How to Calculate Standard Deviation Step by Step
To calculate standard deviation, find the mean, subtract it from every value, square those gaps, add them up, divide by n − 1 for a sample (or n for a whole population), and take the square root. For five quiz scores of 12, 15, 11, 18 and 14, the mean is 14, the squared gaps add to 30, the sample variance is 30 ÷ 4 = 7.5, and the sample SD is √7.5 ≈ 2.74. This guide explains each of those five moves, when to pick sample or population, and how to read the result.
σ Try Standard Deviation Calculator now — freeOpen →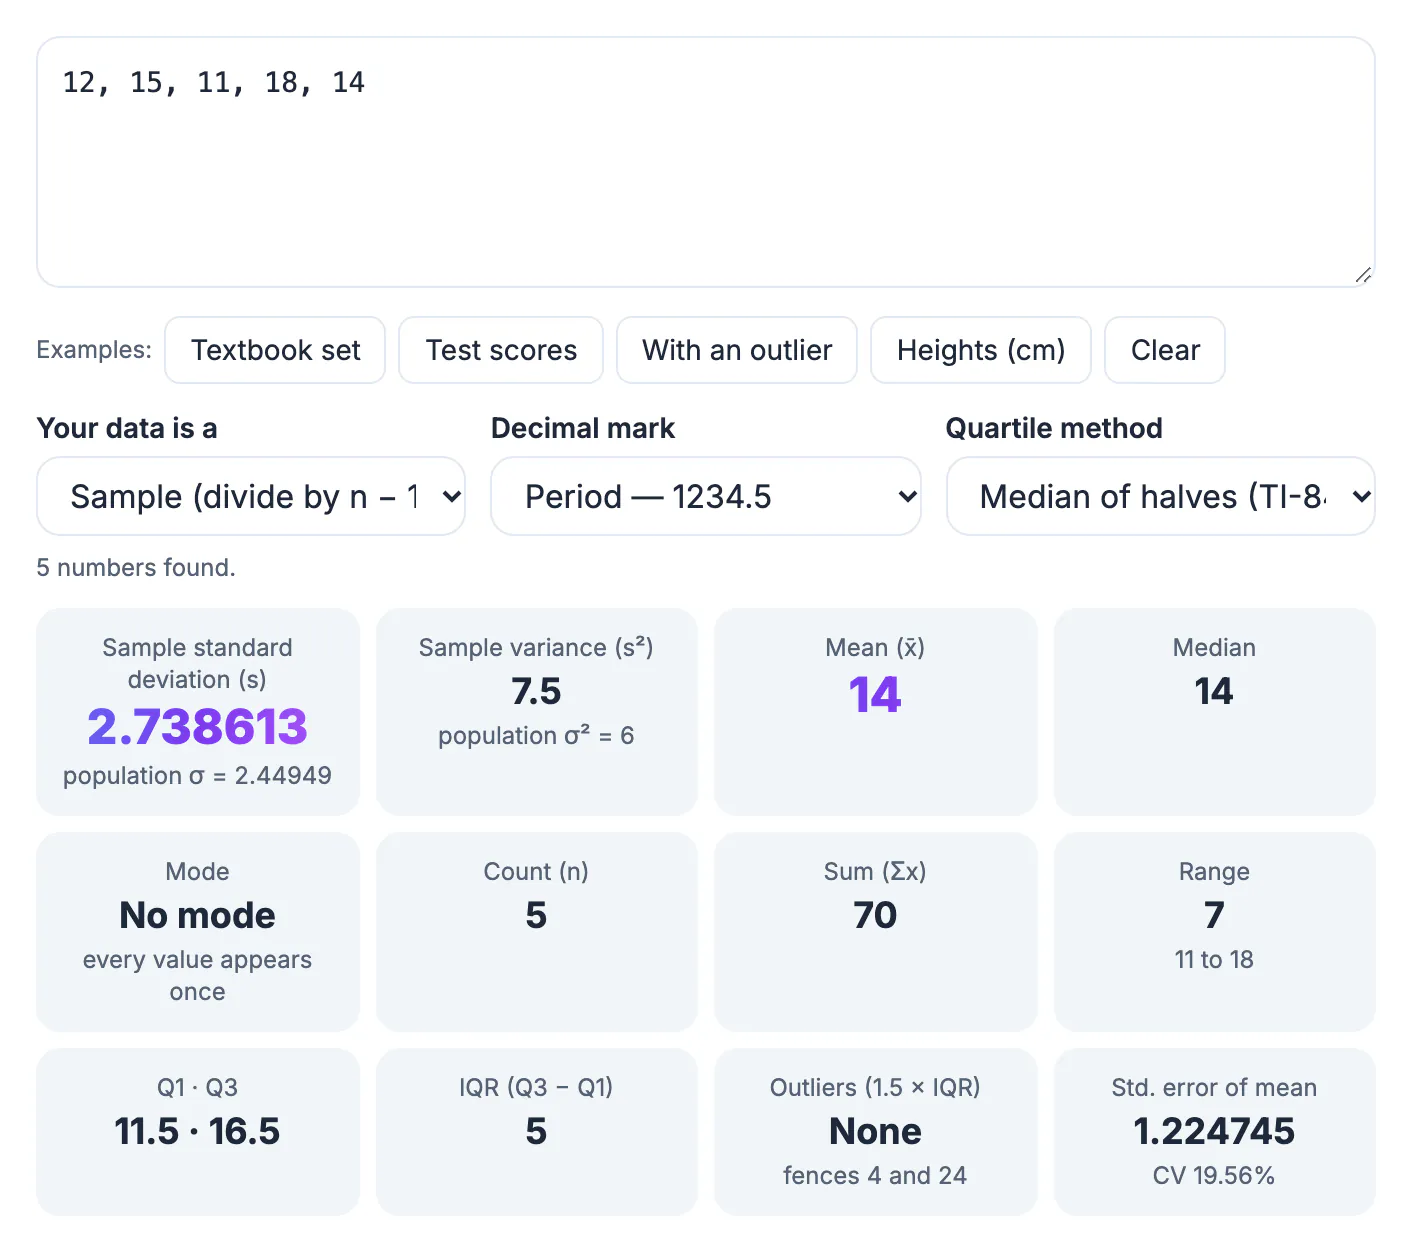
An average hides how spread out the data is. Two classes can both average 14 out of 20, yet one has everyone between 13 and 15 while the other ranges from 6 to 20. The SD puts that spread into a single figure in the same units as the data: a typical score sits about 2.7 points from the mean in our example. Teachers use it to see whether a quiz separated students, labs use it to judge whether repeated measurements agree, and it is the building block for z-scores, margins of error and control charts.
The formula in plain words
There are two versions, and they differ only in the divisor.
- Sample: s = √( Σ(x − x̄)² ÷ (n − 1) ). Use it when your numbers are a subset that stands in for a bigger group.
- Population: σ = √( Σ(x − μ)² ÷ N ). Use it when your list is every member of the group you care about.
- Σ means add up, x is each value, x̄ or μ is the mean, and n or N is how many values there are.
Variance is the same calculation without the final square root. It is useful in further math but hard to interpret, because it is in squared units: squared points, squared dollars, squared centimetres.
Worked example: five quiz scores
Take five scores out of 20: 12, 15, 11, 18 and 14.
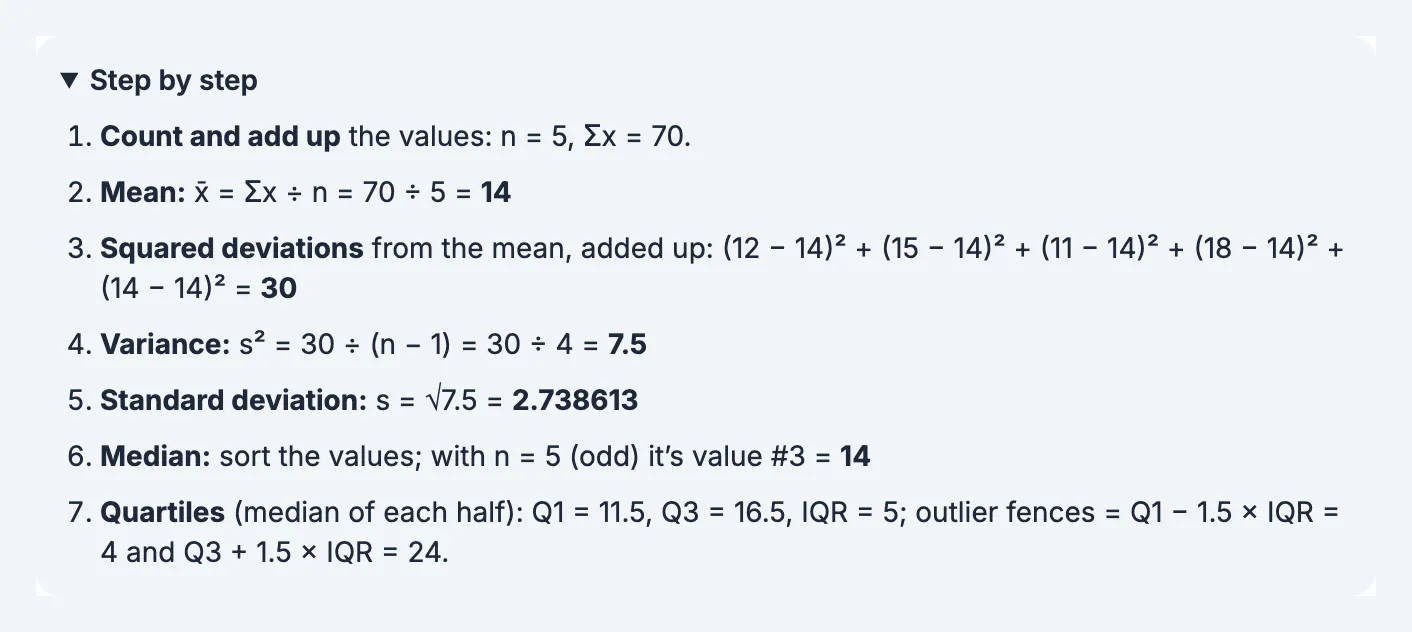
- Add them: 12 + 15 + 11 + 18 + 14 = 70. With n = 5, the mean is 70 ÷ 5 = 14.
- Subtract the mean from each score: −2, 1, −3, 4 and 0. These gaps always sum to zero, which is a quick check on your mean.
- Square each gap: 4, 1, 9, 16 and 0. Their total, the sum of squares, is 30.
- Sample variance: 30 ÷ (5 − 1) = 7.5. Sample SD: √7.5 = 2.738613.
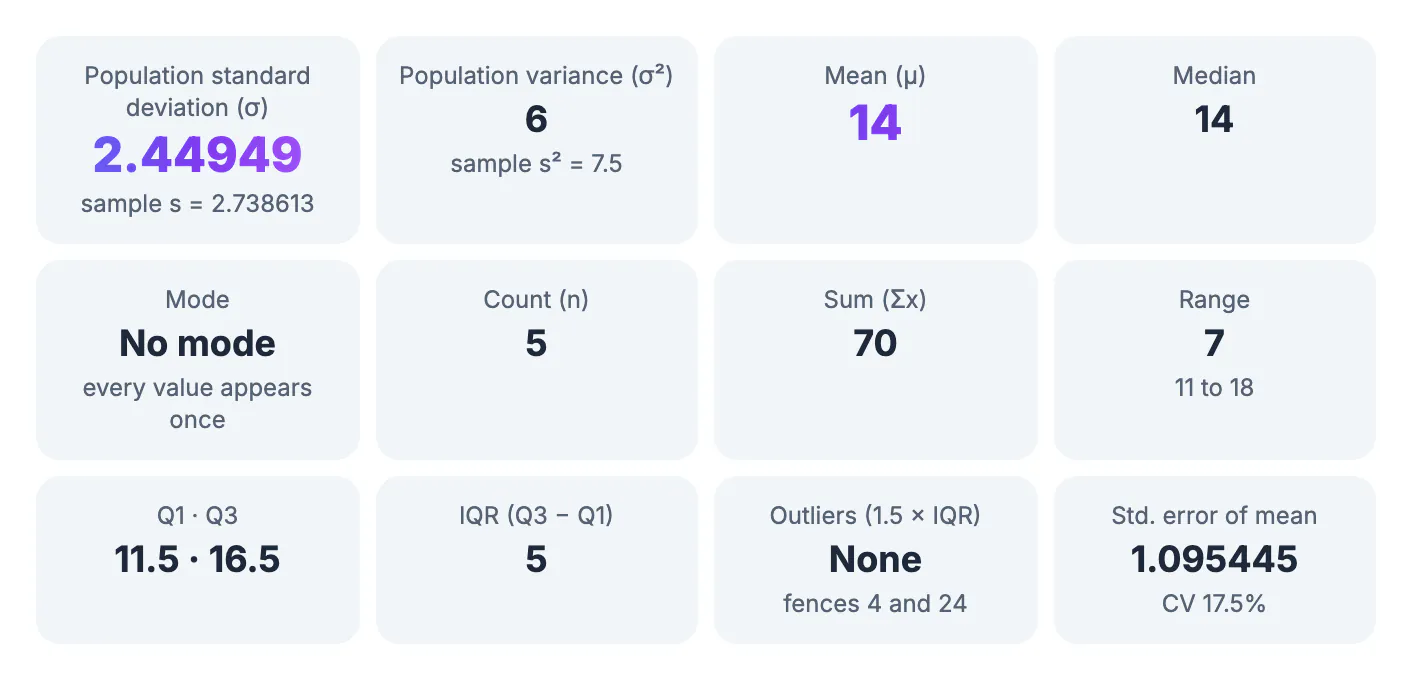
- Population variance: 30 ÷ 5 = 6. Population SD: √6 = 2.44949.
Squaring does two jobs. It removes the minus signs, so gaps below the mean do not cancel gaps above it, and it gives larger gaps more weight. That is why a single score of 18 moves the result more than two scores of 15 would.
Sample or population: which divisor to use
Ask whether you would ever want to say something about people or items that are not in your list. If the five scores are the whole class and you only care about this class, use population. If they are five students picked to estimate how the whole year group did, use sample.
The sample formula divides by n − 1, called Bessel's correction. A sample's values sit a little closer to their own mean than to the true mean of the full group, so dividing by n would understate the spread. With only five values the difference is noticeable, 2.738613 against 2.44949; with 500 values it almost disappears. Most statistics courses, Excel's STDEV.S and the TI-84's Sx use the sample version by default, while STDEV.P and σx give the population figure.
Using the Standard Deviation Calculator
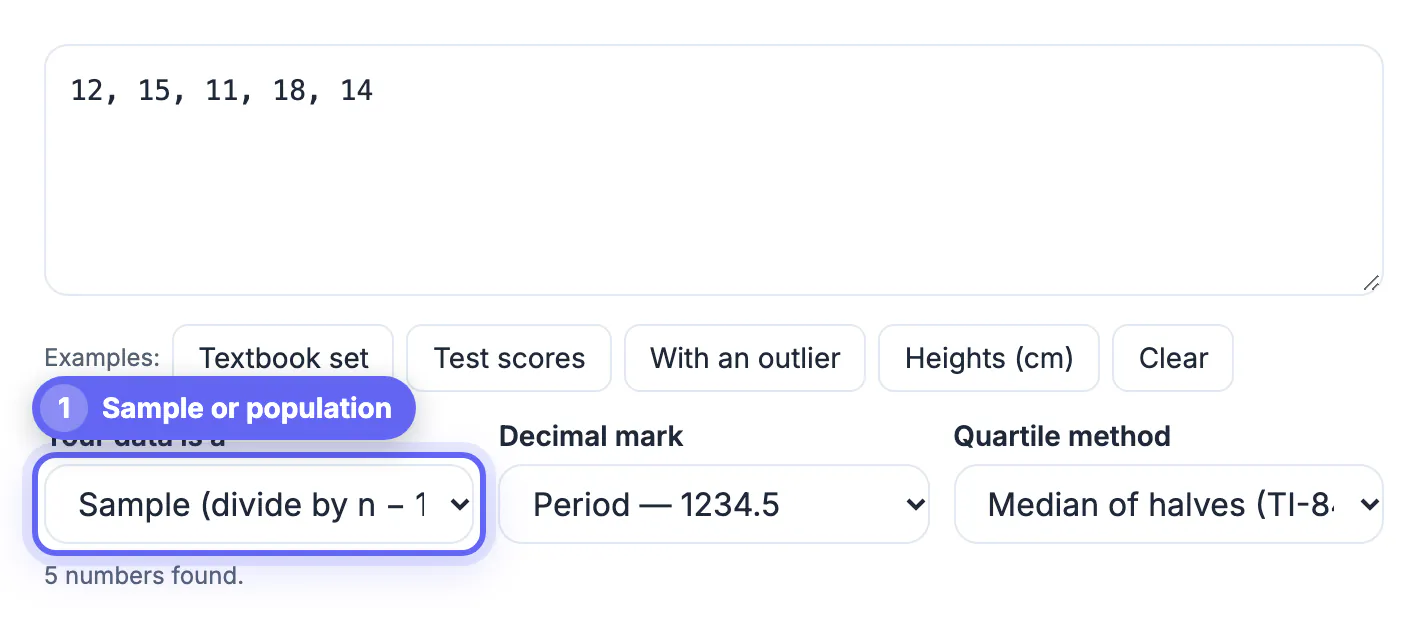
Paste or type your numbers into the Your data box. Commas, spaces, tabs, semicolons and new lines all work, so a column copied from a spreadsheet goes straight in, and a note underneath confirms how many numbers were found. Anything that is not a number is listed as ignored rather than silently dropped.
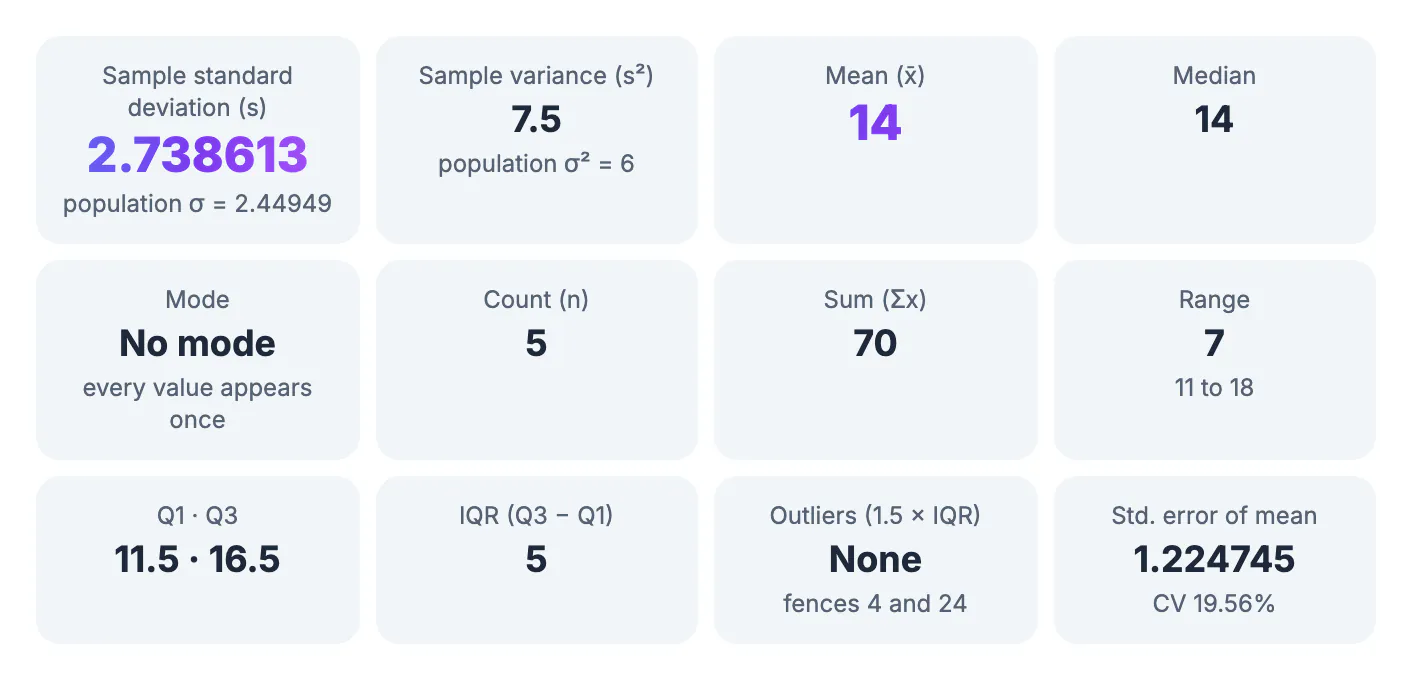
Pick Sample (divide by n − 1) or Population (divide by n) in the Your data is a menu. The results update at once: a large SD card with the other version shown beneath it, then variance, mean, median, mode, count, sum, range, Q1 and Q3, IQR, outliers by the 1.5 × IQR rule, and the standard error of the mean with the coefficient of variation. Decimal mark lets you switch to comma decimals, and Quartile method offers Median of halves (TI-84, most textbooks), Excel QUARTILE.INC or Excel QUARTILE.EXC.
If you want to practise before entering your own data, the Examples buttons load ready-made lists: Textbook set, Test scores, With an outlier and Heights (cm). Clear empties the box. Below the results, Copy results puts the summary on your clipboard, and Z-scores CSV downloads a table with each value, its gap from the mean, the squared gap and its z-score, which is useful when you need to show every row of the working.
Reading the rest of the results
For the quiz data the calculator also reports a median of 14, a range of 7 (11 to 18), Q1 = 11.5, Q3 = 16.5 and an IQR of 5. The outlier fences are 4 and 24, so no score is flagged. Mode says No mode, because every value appears once.
Standard error of the mean is the SD divided by √n: 2.738613 ÷ √5 = 1.224745. It describes how much the average itself would wobble from sample to sample, which is why it is smaller than the SD. The coefficient of variation, CV 19.56%, is the SD as a percentage of the mean and lets you compare spread between data sets on different scales. The Step by step panel lists each stage with your own numbers, so you can copy the working into homework or a report.
For checking a grade set, see the Grade Calculator, and for extra math the Scientific Calculator helps.
Step-by-step
Common mistakes to avoid
Pro tips
Frequently asked questions
What is the quickest way to find standard deviation by hand?
Find the mean, square each value's distance from it, add those squares, divide by n − 1 for a sample or n for a population, and take the square root.
Should I use n or n − 1?
Use n − 1 when your data is a sample from a larger group and n when it covers the entire group. Most coursework expects the sample version unless it says otherwise.
What does a standard deviation of 2.74 mean?
For the five quiz scores, values typically sit about 2.74 points from the mean of 14. One SD either side of the mean runs from about 11.3 to 16.7, a band that holds three of the five scores.
Why is the sample SD larger than the population SD?
Dividing by n − 1 instead of n makes the variance bigger. For our data that is 7.5 against 6, so the SD is 2.738613 against 2.44949.
Can I paste a column from Excel or Google Sheets?
Yes. Copy the column and paste it into Your data; new lines, tabs and commas are all treated as separators, and the note shows how many numbers were found.
Mean, gaps, squares, divide, square root: that is the whole method. Choose n − 1 for a sample and n for a complete population, keep decimals until the end, and use the step list to check your own working line by line.
Related guides
Browse more: all calculator guides · Standard Deviation Calculator