Standard Deviation by Hand vs Calculator: When to Use Each
Should you work out a standard deviation by hand or let a calculator do it? By hand is the right choice when you are learning the idea, when an exam asks you to show working, or when the list is short. A calculator is better for anything longer than ten or so values, for decimals, and for extras like quartiles and z-scores. The strongest approach is to combine them: do the table on paper, then check every line against a tool that shows its steps. Here is that comparison on six commute times: 22, 25, 31, 28, 24 and 26 minutes.
σ Try Standard Deviation Calculator now — freeOpen →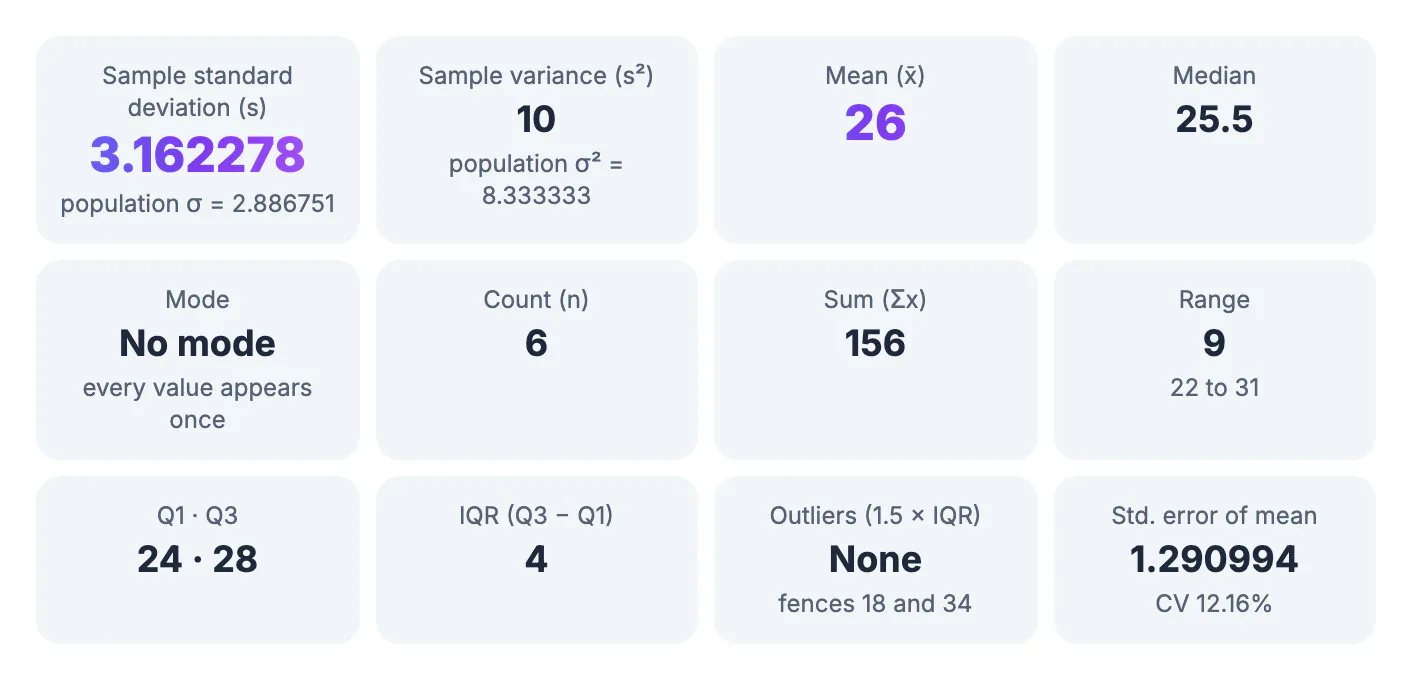
Most wrong answers in statistics homework are not caused by a misunderstanding of the formula. They come from a slipped subtraction, a forgotten square or the wrong divisor. Working by hand exposes each of those steps, which is how you learn to spot them, but it also gives you more places to go wrong. A calculator removes arithmetic slips but hides the process, and it will happily give a precise answer for the wrong setting. Knowing what each method is good at lets you pick the one that fits the task, or use one to audit the other.
Working it out by hand: the table method
On paper, the cleanest layout is a three-column table. Write each value, its gap from the mean, and that gap squared. For the six commute times the total is 156, so the mean is 156 ÷ 6 = 26 minutes.
- 22 → −4 → 16
- 25 → −1 → 1
- 31 → 5 → 25
- 28 → 2 → 4
- 24 → −2 → 4
- 26 → 0 → 0
The squared column adds to 50. Divide by n − 1 = 5 for a sample variance of 10, and take the root: s = √10 ≈ 3.162278 minutes. If these six days are your whole record and you only want to describe them, divide by 6 instead for σ² ≈ 8.333333 and σ ≈ 2.886751. With whole-number data like this, the hand method takes a few minutes and the numbers stay easy to check.
Quiz scores turn into percentages with this grade percentage guide, and the Scientific Calculator handles square roots.
The shortcut formula and why it can mislead
Many textbooks also teach a computational shortcut: add the squares of the raw values, subtract (Σx)² ÷ n, and use that as the sum of squared gaps. For our data Σx² = 4,106 and (156)² ÷ 6 = 4,056, so the difference is 50, the same as the table.
It saves one column, but it subtracts two large, nearly equal numbers. With values like 1,002.4 and 1,003.1, small rounding errors in those big totals can swamp the real answer, and on a basic calculator the result can even come out slightly negative. The table method keeps the numbers small, which is why it is safer by hand and why good software computes the gaps from the mean directly.
What the calculator adds
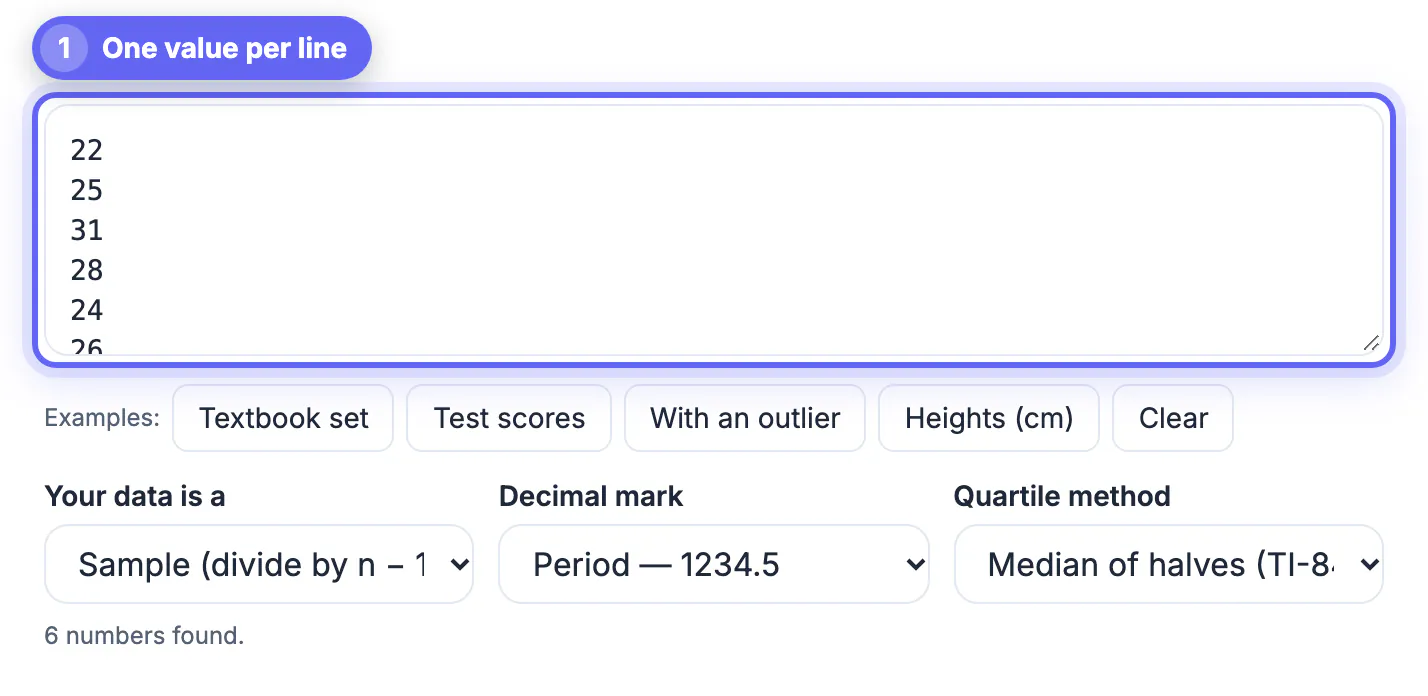
With the values entered one per line, the Standard Deviation Calculator shows the same answer straight away, 3.162278 with population σ = 2.886751 underneath, and a lot that would take much longer on paper.
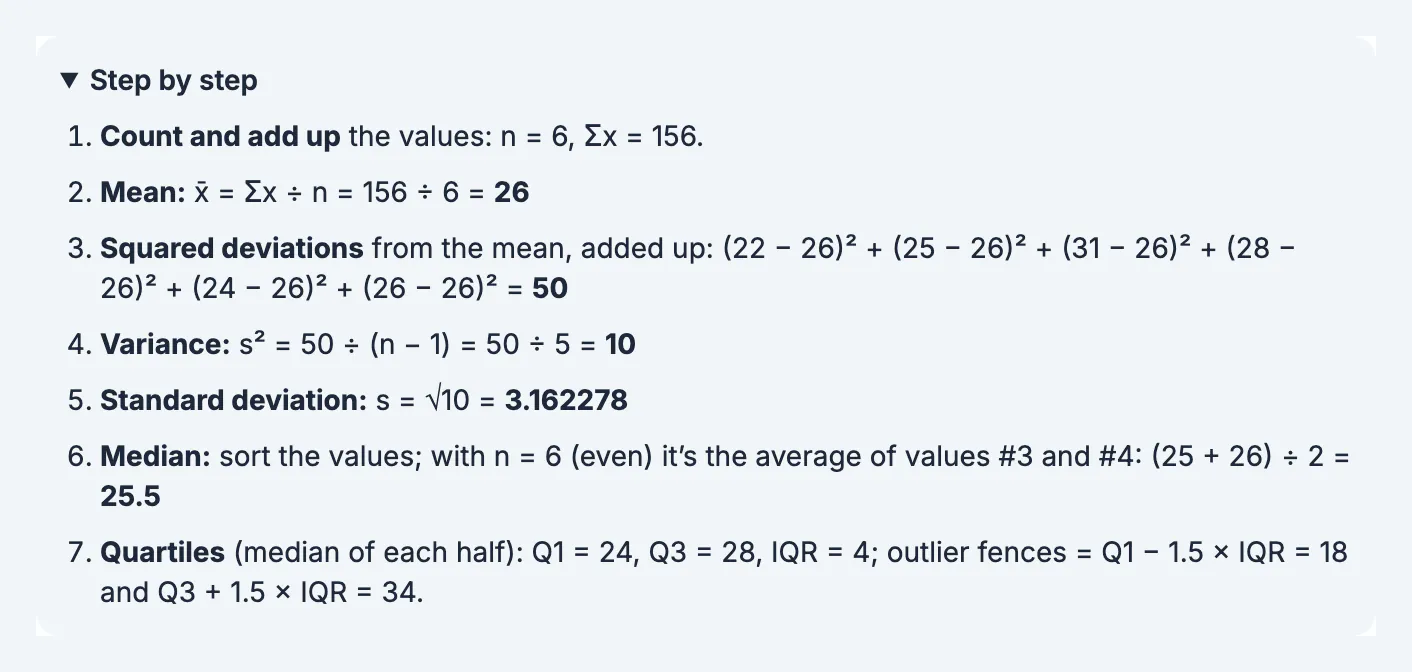
- Step by step repeats the hand method with your numbers: n = 6, Σx = 156, mean 26, squared deviations 50, s² = 50 ÷ 5 = 10.
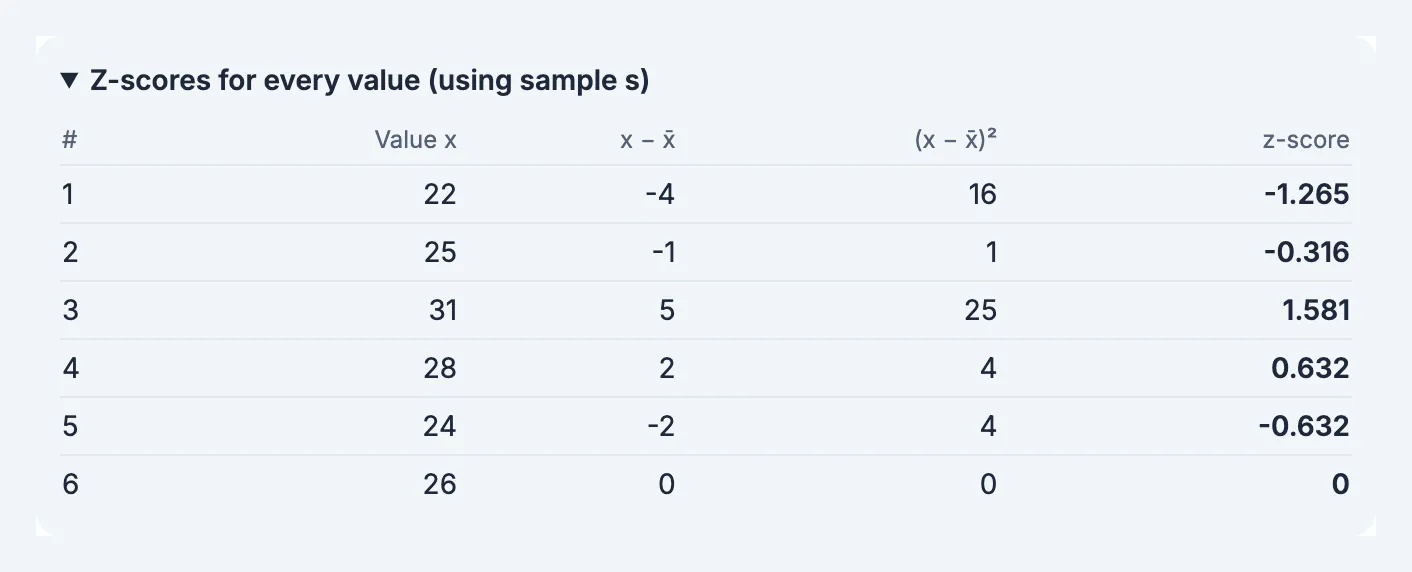
- Z-scores for every value (using sample s) is the table you drew, plus a z-score column: 31 minutes sits 1.581 SDs above the mean and 22 sits 1.265 below.
- The quartile cards give Q1 = 24, Q3 = 28 and IQR = 4, with outlier fences at 18 and 34, so no day is flagged.
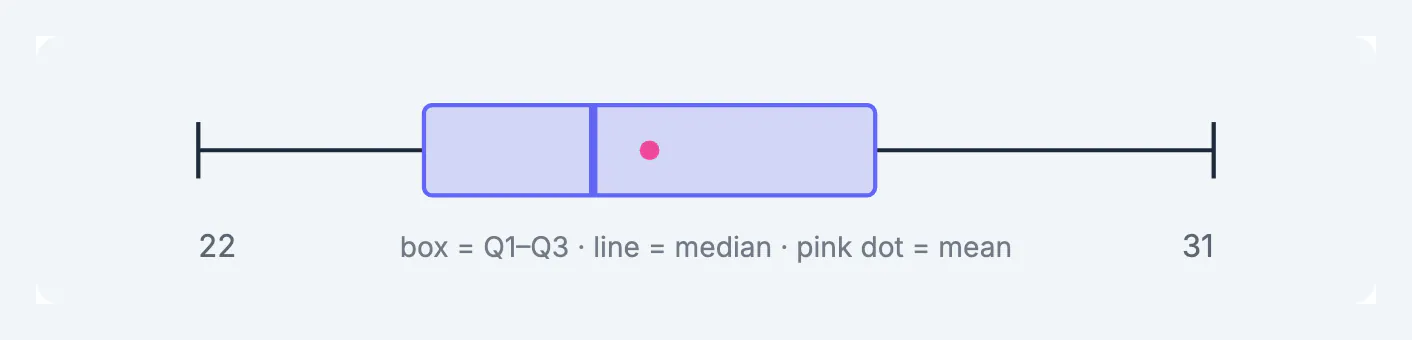
- A box plot draws the range 22 to 31, the box from Q1 to Q3, the median line at 25.5 and a pink dot for the mean.
It also handles what makes hand work painful: long lists pasted from a spreadsheet, decimals with a comma as the Decimal mark, and three Quartile method options (Median of halves, Excel QUARTILE.INC and Excel QUARTILE.EXC) for matching a textbook or a spreadsheet.
Side by side: which method wins where
- Learning the concept: by hand. Filling in each gap and square is what makes the formula mean something.
- Exams without a calculator, or ones that award marks for working: by hand, using the table layout.
- Ten values or fewer with whole numbers: either; by hand is quick and the tool is a free check.
- Dozens or hundreds of values, or decimals: calculator. Hand work becomes slow and error-prone.
- Reports and lab write-ups: calculator for the numbers, with the step list or z-score table as the shown working.
- Checking homework: both. Do it on paper, then compare line by line.
A useful rule: if you would need more than one sheet of paper, or you keep rounding in the middle, switch to the calculator and spend the saved time interpreting the result.
Using a calculator to audit your hand answer
When your paper answer and the tool disagree, work down the Step by step list rather than redoing everything. Check the count and total first, since one missed value changes all later steps. Then compare the mean, then the sum of squared deviations, which is where most slips happen. The z-score table shows each gap and square for every row, so a single wrong entry is easy to spot. Finally, check the divisor: if your answer is 2.886751 rather than 3.162278, you divided by n where the question wanted a sample.
Step-by-step
Common mistakes to avoid
Pro tips
Frequently asked questions
Is it better to calculate standard deviation by hand or with a calculator?
By hand is better for learning and for exams that ask for working. A calculator is better for long lists, decimals and extras like quartiles or z-scores. Checking a hand answer with a calculator gives you both.
How long does it take to find standard deviation by hand?
For six whole numbers like the commute times, a few minutes with a three-column table. With 30 or more values, or decimals, it becomes slow and a calculator is the practical choice.
Why does my hand answer differ slightly from the calculator?
Usually rounding: rounding the mean or the squares early shifts the last decimals. A bigger gap usually means a wrong divisor, a missed value or an arithmetic slip in one row.
What is the shortcut formula for standard deviation?
Sum of squares = Σx² − (Σx)² ÷ n. For 22, 25, 31, 28, 24, 26 that is 4,106 − 4,056 = 50. It saves a column but is less reliable with large decimal numbers.
Does the calculator show the working?
Yes. Step by step lists the count, sum, mean, squared deviations, variance and root with your numbers, and a z-score table shows each value's gap and squared gap.
Do it by hand to learn the method and to earn marks for working; use a calculator for long or messy data and for quartiles, z-scores and box plots. For homework, do both: paper first, then compare every line with the step list so any slip shows up at once.
Related guides
Browse more: all calculator guides · Standard Deviation Calculator