How to Calculate Social Media Engagement Rate
Engagement rate is the share of people who reacted to a post out of the people who could have. The basic formula is interactions divided by an audience number, times 100. The confusion comes from the audience number: some tools divide by views, some by reach, some by impressions and some by followers, and each gives a different percentage for the same post. This guide explains how to calculate social media engagement rate each way, when each version is the right one, and how to compare Instagram, TikTok and YouTube fairly. You will also see how GrabCast's free Social Media Analytics Dashboard calculates it from the export files the platforms give you, using a fictional yoga studio's September numbers as the example.
📊 Try the Social Media Analytics Dashboard now — freeOpen →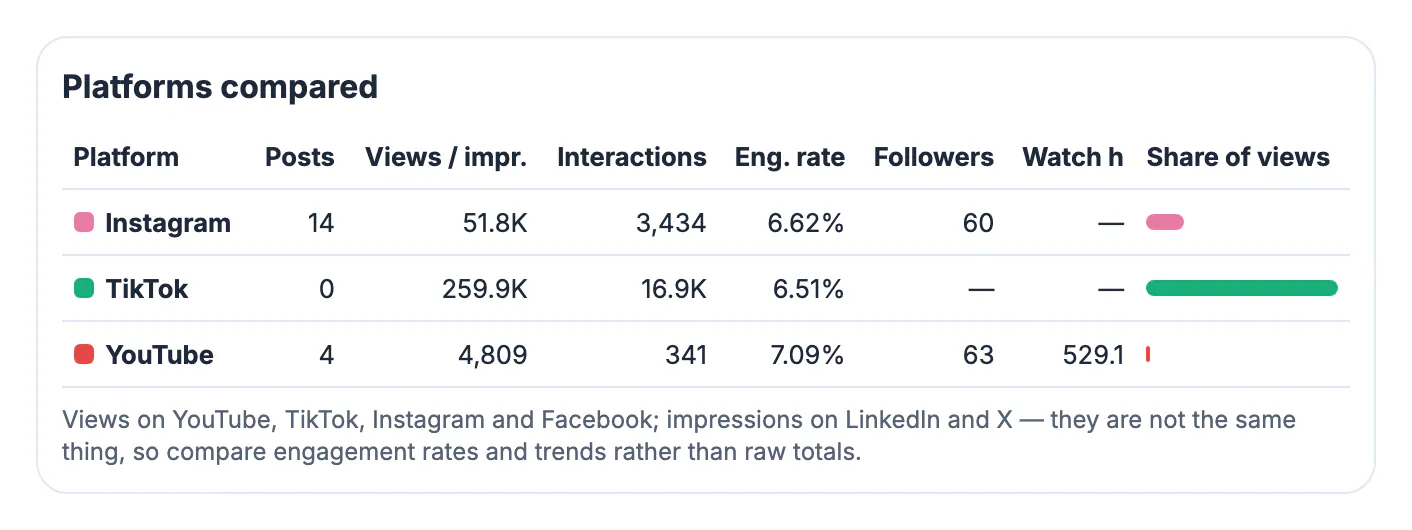
A post with 400 likes sounds better than one with 90, until you learn the first was shown to 20,000 people and the second to 1,000. Raw counts grow with reach, so they reward whatever the algorithm happened to push rather than what people genuinely responded to. A rate removes the size effect and lets you compare posts, formats and platforms on one scale. It also exposes problems early: rising views with a falling rate often means a post is reaching people outside your audience, while a steady rate on smaller reach suggests loyal followers and a distribution problem. Brands and sponsors ask for engagement rate for the same reason. The catch is consistency: pick one definition, write it down, and use it every month.
The engagement rate formulas, side by side
All versions share the same top line, interactions, which usually means likes or reactions plus comments plus shares plus saves. What changes is the denominator.
- By views: interactions divided by views, times 100. Best for video-first platforms such as TikTok, Reels and YouTube, where views are the main audience number.
- By reach: interactions divided by the number of unique accounts reached. Common for Instagram and Facebook, where one person can see a post several times.
- By impressions: interactions divided by impressions. Used by LinkedIn and X, which report impressions rather than views.
- By followers: interactions divided by follower count. Easy to compute from the outside, which is why influencer marketplaces use it, but it ignores how many followers actually saw the post.
A worked example: a Reel with 4,000 views, 2,900 reached accounts, 230 likes, 18 comments, 12 shares and 30 saves has 290 interactions. By views that is 7.25 percent; by reach, 10.0 percent; by a follower count of 12,000, 2.4 percent. Same post, three honest numbers. You can check any of them with the percentage calculator.
How to calculate social media engagement rate across platforms
Comparing platforms is where most spreadsheets go wrong. The platforms do not define the audience number the same way, and some count interactions differently.
- Use the same formula for every platform you compare, and say which one you used.
- Where a platform reports impressions instead of views, note it. Impressions and views are not the same thing, so compare rates and trends rather than raw totals.
- Weight totals by views. Averaging per-post percentages gives a tiny post the same say as a viral one; dividing total interactions by total views does not.
- Keep saves and shares in the count. They signal stronger intent than likes, and dropping them understates formats such as carousels.
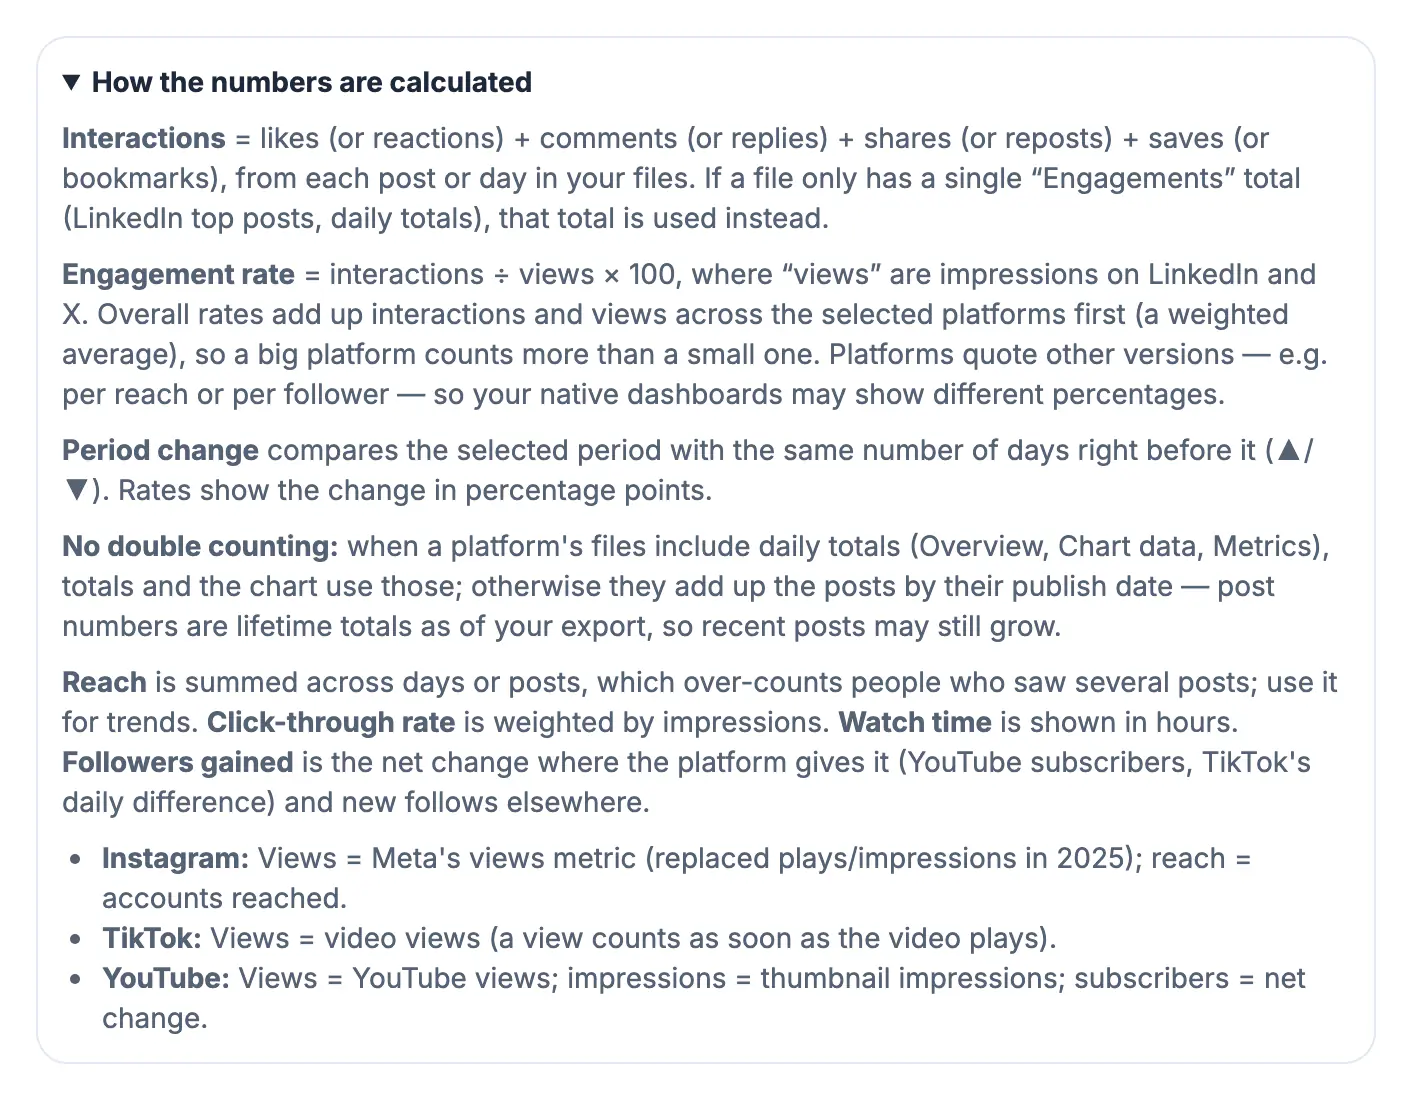
The dashboard follows these rules. Its engagement rate is interactions (likes or reactions, comments, shares or reposts, saves or bookmarks) divided by views, times 100, with impressions used for LinkedIn and X, and cross-platform totals weighted by views. The How the numbers are calculated panel on the page spells this out, which is useful when you need to explain a figure to a client.
Worked example: one studio, three platforms
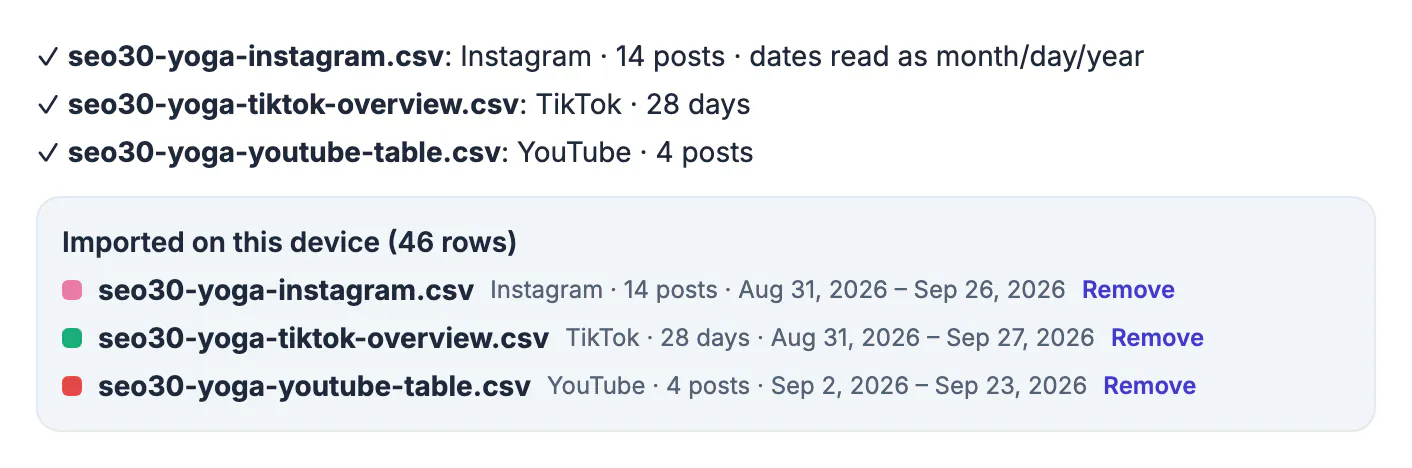
Pine and Pose Yoga, a fictional studio, exported four weeks of data from three places: Instagram content from Meta Business Suite, the daily TikTok Studio overview and YouTube Studio's Advanced mode table data. Dropping all three files on the dashboard produced one Platforms compared table with posts, views, interactions, engagement rate and followers per platform.
- TikTok brought about five times Instagram's views, 259.9K, at a 6.51 percent rate, which fits short videos shown widely to people who do not follow the studio yet.
- Instagram had 51.8K views and a slightly higher 6.62 percent rate.
- YouTube full classes had the smallest audience, 4,809 views across four videos, and the highest rate, 7.09 percent, plus 529 hours of watch time: a small, committed audience doing a different job from the short clips.
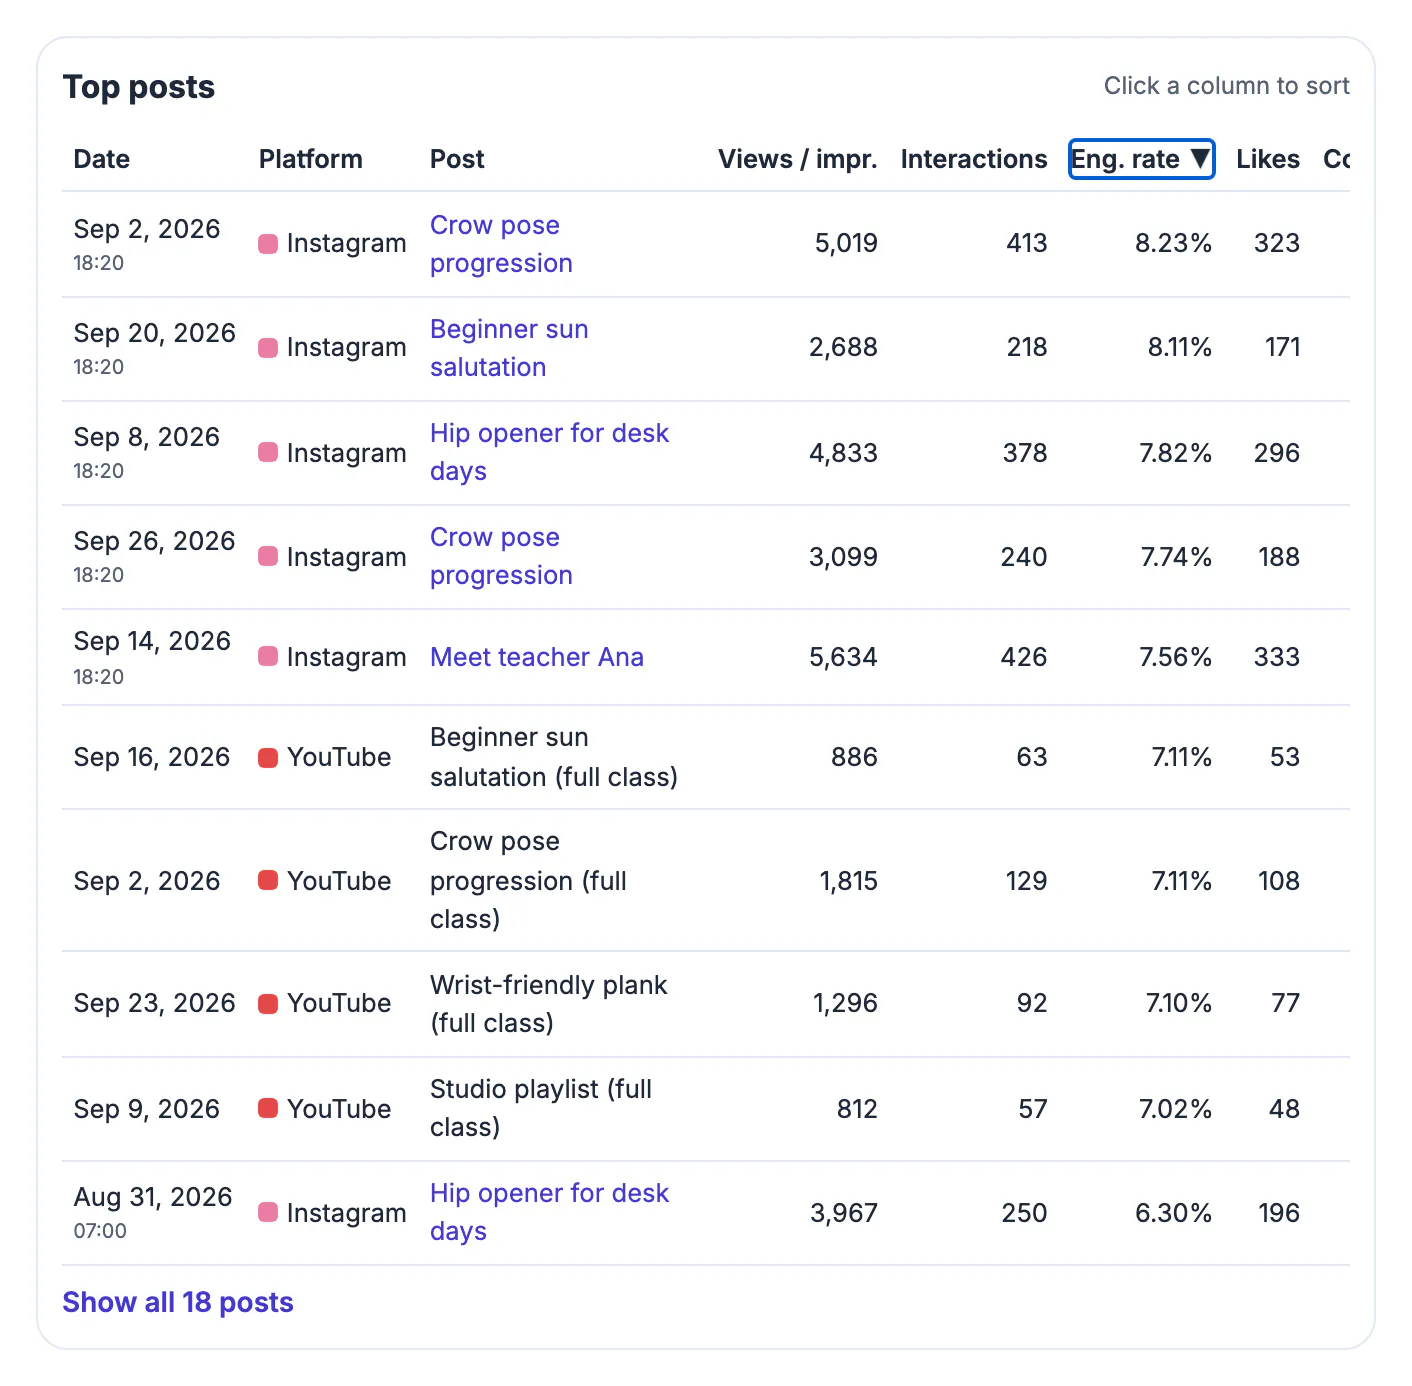
The useful conclusion was not which platform wins. Sorting Top posts by the Eng. rate column showed that the five best posts were all Instagram posts published at 18:20, while the 7:00 posts sat lower, so the next month's plan moved Instagram to evenings and kept TikTok for reach.
What counts as a good engagement rate
There is no universal benchmark worth trusting. Rates vary by platform, by formula, by account size and by niche, and published averages rarely say which formula they used.
- Compare with your own history first: the same account, the same formula, month over month.
- Expect smaller accounts to show higher rates than very large ones; a loyal few react more than a broad crowd.
- Compare formats inside one platform: carousels versus Reels versus single photos.
- Watch the direction. A rate that holds while reach grows is healthy; a rate that sinks as reach grows means new viewers are less interested.
If you publish on a schedule, keep the export habit monthly and use it to test the best time to post for your own audience. The business guides hub links the reporting and scheduling guides that build on this number.
Step-by-step
Common mistakes to avoid
Pro tips
Frequently asked questions
What is the formula for engagement rate?
Interactions divided by an audience number, times 100. The audience number can be views, reach, impressions or followers, so always state which one you used.
Which engagement rate formula is best?
For your own analysis, views or reach, because they count people who actually saw the post. By followers is common in influencer deals because outsiders can compute it.
Why does my number differ from the platform's own dashboard?
Platforms define views, reach and engagement differently, and exports are lifetime totals at the moment you exported them. Small differences from a native summary card are normal.
Can I compare engagement rate between TikTok and LinkedIn?
Carefully. TikTok reports views and LinkedIn reports impressions, which are not the same measure, so compare trends and relative rates rather than treating the percentages as identical.
Does the dashboard upload my data?
No. The files are read in your browser and stored only on this device until you clear them. There are no logins or API connections.
Engagement rate is simple arithmetic with one trap: the denominator. Pick views, reach, impressions or followers deliberately, use the same formula everywhere, weight totals by views, and compare against your own history before any benchmark. Let the dashboard do the arithmetic from your exports, then spend your time on what the number tells you to post next.
Related guides
Browse more: all business guides · the Social Media Analytics Dashboard