Best Time to Post on Social Media: Find Your Own Hours
The best time to post on social media is the time your own followers are online and in the mood to react, and that is different for a coffee roaster, a night-shift nurse and a gaming channel. Published charts that name one hour for everyone are averages across millions of unrelated accounts, so treat them as a starting guess at most. A better answer comes from data you already own: every major platform lets you export your post history with publish times and results. This guide shows how to turn those exports into a weekday and hour heatmap with GrabCast's free Social Media Analytics Dashboard, how to read it without fooling yourself, and how to test the answer so it keeps improving. The worked example is a fictional coffee roaster that exported eight weeks of Instagram and Facebook posts.
📊 Try the Social Media Analytics Dashboard now — freeOpen →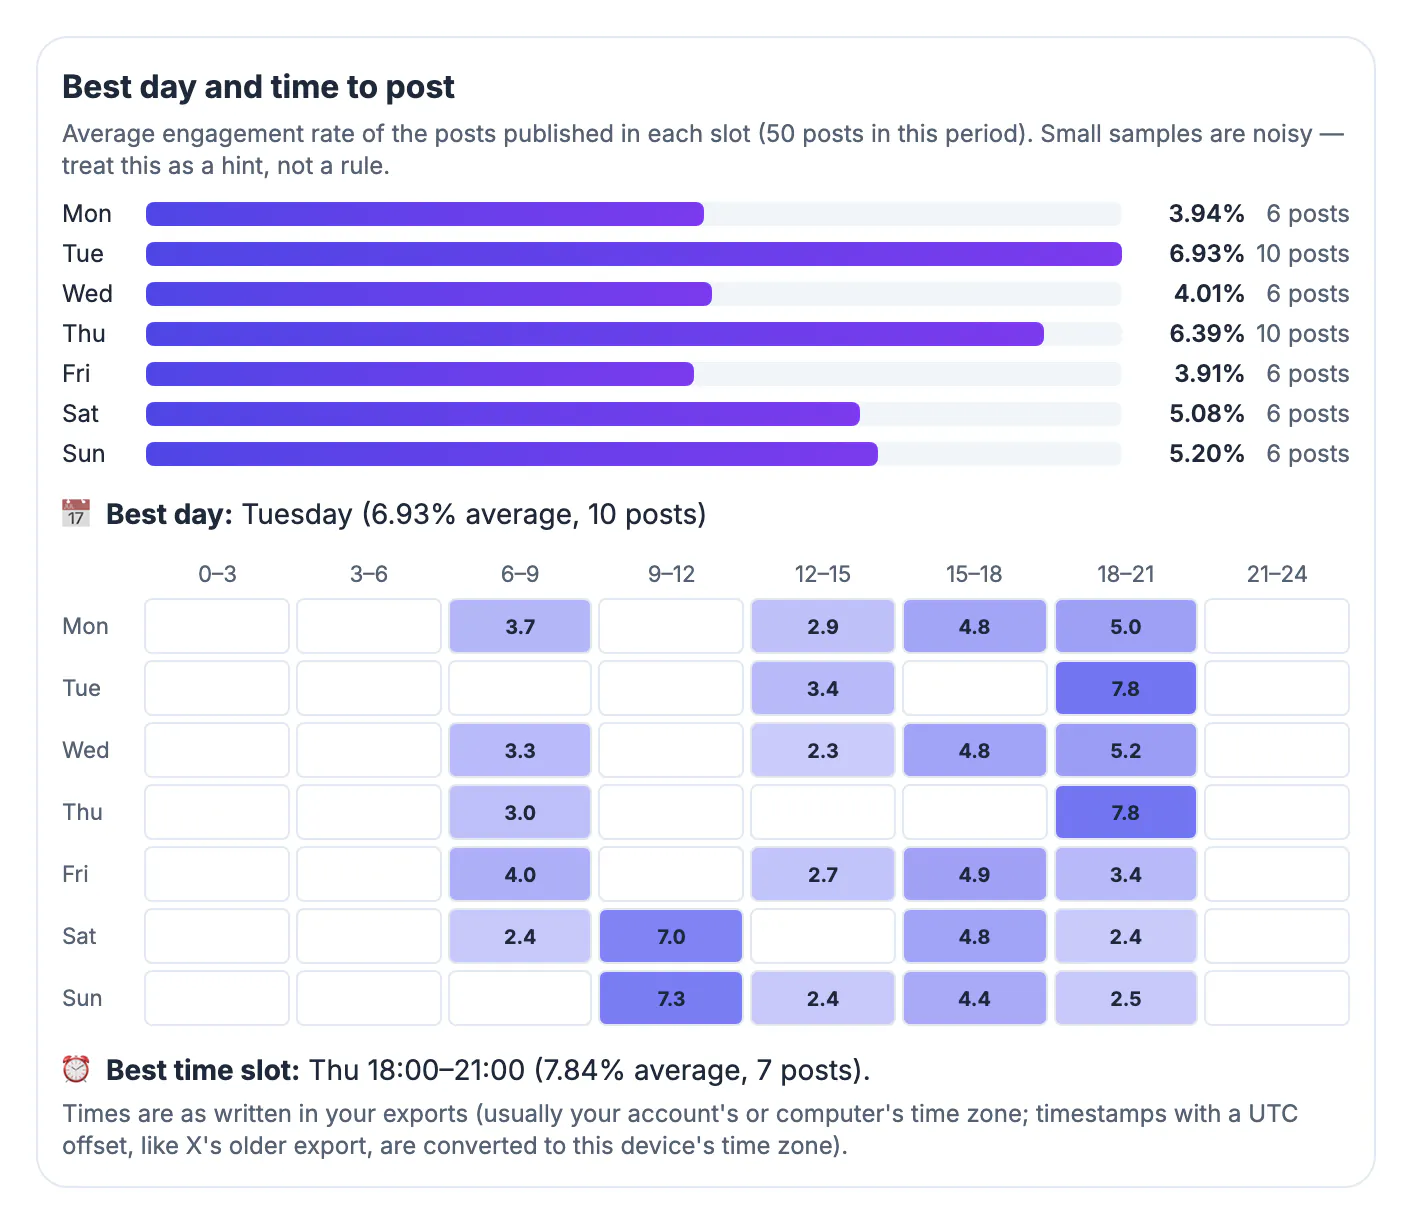
Posting-time studies average engagement across huge samples of accounts in many countries, niches and time zones. Your audience is one small, specific slice of that crowd. A roaster whose customers read Instagram after dinner gets nothing from a chart that says Wednesday at 11 AM, and a B2B account on LinkedIn behaves nothing like a creator on TikTok. Timing also interacts with the content itself: a Reel posted at a quiet hour can still travel through recommendations for days, while a time-sensitive offer needs to land when people can act on it. The honest approach is to look at when your own posts did well, adjust for how many posts sit behind each number, and then run small, deliberate tests. That takes one export and fifteen minutes, and it beats copying someone else's schedule.
What the best time to post on social media really depends on
Three things decide whether an hour works for you: when your followers are active, how the platform distributes posts, and what the post asks people to do.
- Audience rhythm: commuters scroll at 7 AM and 6 PM, parents after 8 PM, students late at night, office buyers on weekday mornings.
- Time zone mix: if half your followers are on the West Coast, a 9 AM Eastern post lands at 6 AM for them.
- Distribution: chronological feeds such as Bluesky's Following feed reward being there when people look; recommendation feeds on TikTok and Reels keep testing a post for longer, so timing matters less but still shapes the first hour.
- Intent of the post: a same-day offer, a live event or a restock must go out early enough to act on; an evergreen tip can go out whenever you have the most attention.
Each platform also shows a simpler hint in its own app. Instagram's professional dashboard and TikTok Studio show when followers are most active, and YouTube Studio's Audience tab shows when your viewers are on YouTube. Those charts show presence, not reaction. The export-based heatmap below adds the missing half: when your posts actually earned likes, comments, shares and saves.
Export your post history from each platform
You need per-post exports that include a publish time. Each platform puts the button in a slightly different place, and menus move, so if a label differs look for Export or Download data near the analytics table.
- Instagram and Facebook: Meta Business Suite, Insights, Content, then Export data. Pick the widest date range you can.
- TikTok: TikTok Studio, Analytics, then Download data. The Content export has post times; the Overview export is per day.
- LinkedIn: page or creator analytics, then Export. The All posts sheet has times.
- YouTube and X: their content exports carry dates but not times, so they feed the totals and trend chart but not the hour heatmap.
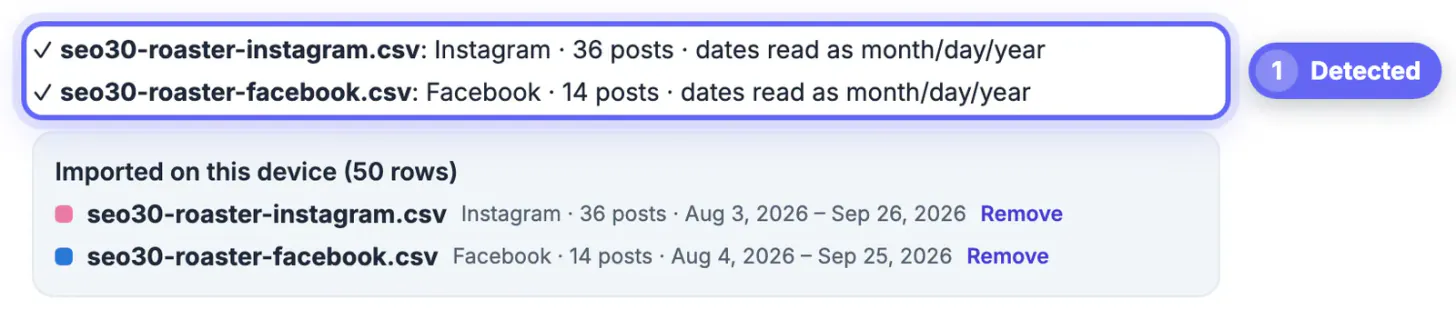
The dashboard reads CSV and XLSX files in your browser; nothing is uploaded and there is no login or API connection. Drop several files at once and each one is recognized from its column names. For the roaster, two Meta files produced 36 Instagram posts and 14 Facebook posts between August 3 and September 26.
Read the day and hour heatmap without fooling yourself
Scroll to Best day and time to post. The top row averages the engagement rate of posts published on each weekday; the grid below splits the week into 3-hour slots. Engagement rate here is interactions divided by views, so a slot with small but loyal audiences can beat a slot with big but passive ones.
- Check the post count behind every number. A slot with one post is an anecdote; the dashboard prints the count so you can discount thin cells.
- Compare neighbors, not extremes. The roaster's Tuesday and Thursday 18:00 to 21:00 cells both sat at 7.8 percent while most 6:00 to 9:00 cells stayed between 2 and 4 percent, a pattern rather than a fluke.
- Look for content confounds. If every Tuesday evening post was a new coffee launch, the topic may be doing the work, not the hour.
- Mind time zones. Times are shown as written in your export, which is usually your account's or computer's zone.
The roaster's result read Best day: Tuesday at 6.93 percent over 10 posts, and Best time slot: Thursday 18:00 to 21:00 at 7.84 percent over 7 posts. That is a strong hint, not a law, which is exactly how the dashboard labels it.
Turn the answer into a posting schedule, then test it
A heatmap only pays off when it changes what you publish and when. Move one variable at a time so you can tell what worked.
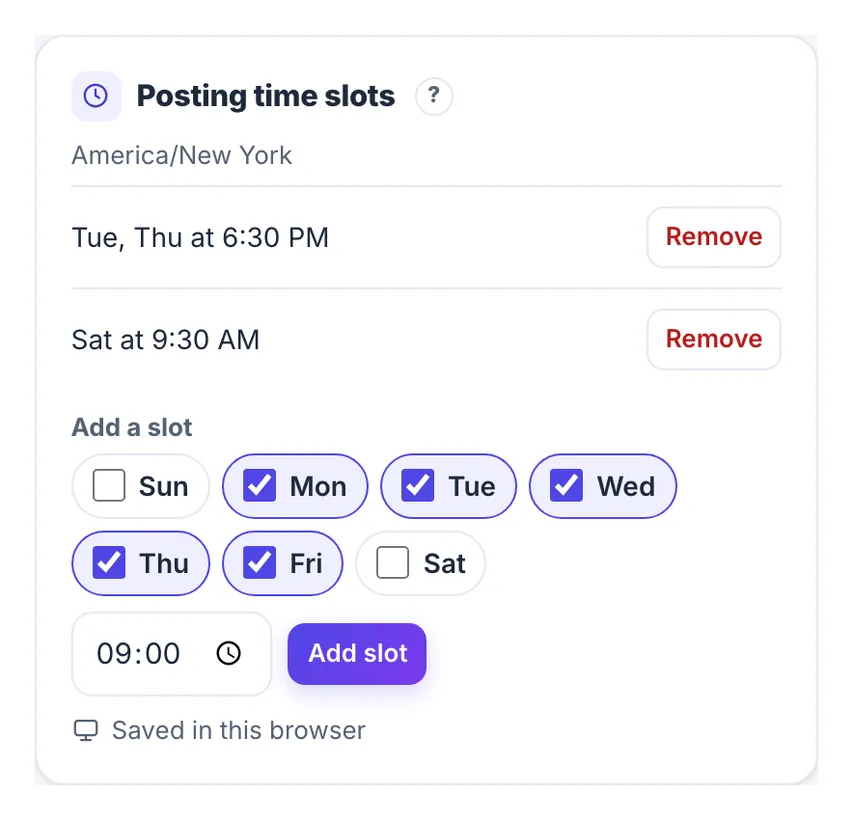
- Put your two best slots into the Social Media Scheduler as queue time slots, so Add to queue drops each new post into the next good hour.
- Run a four-week test: keep the content mix steady, post in the new slots, and keep one post a week in an old slot as a control.
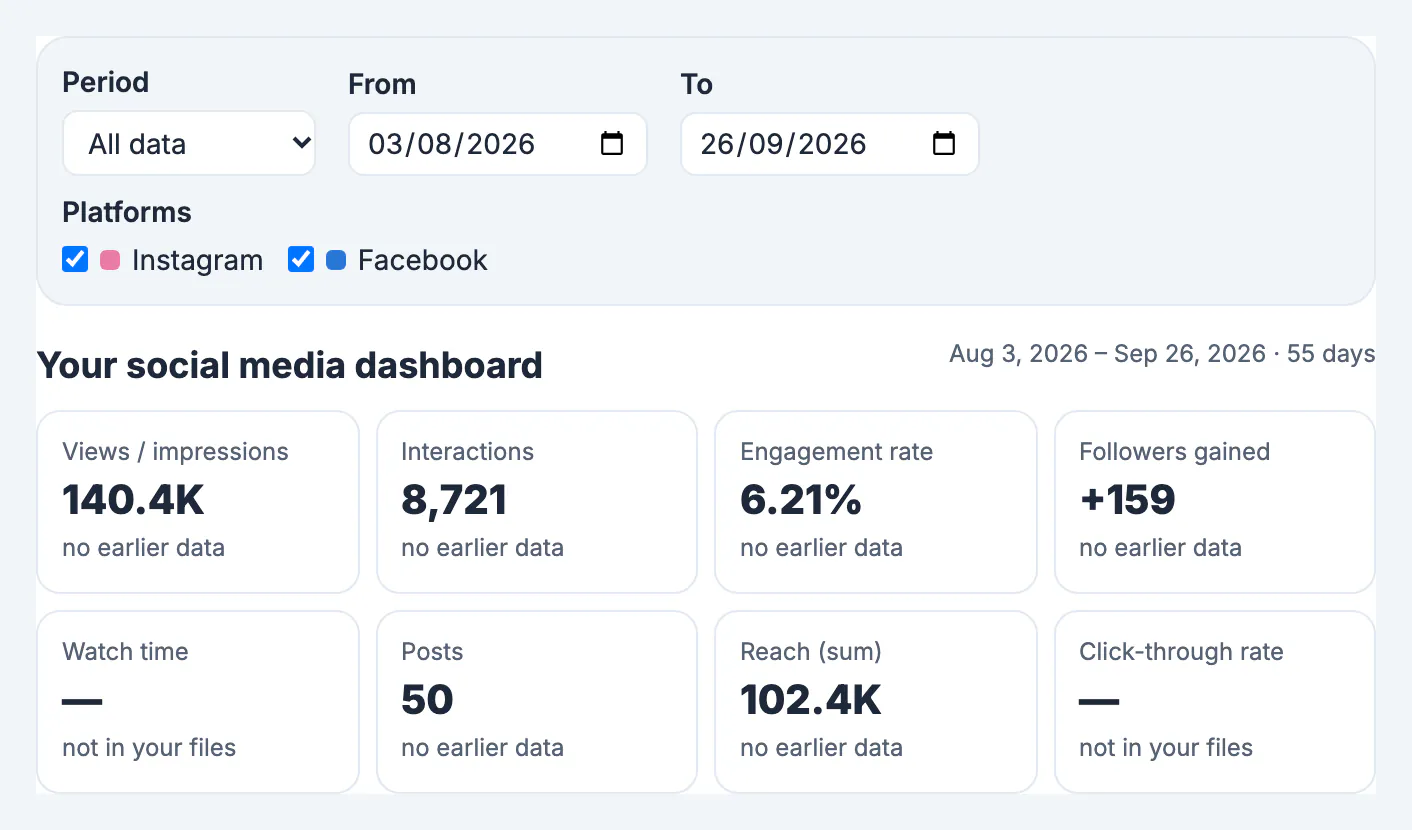
- Export again after the test, drop the new files on the dashboard and compare the period with the previous one using the change arrows on the summary cards.
- Repeat each quarter. Audiences shift with seasons, school terms and daylight saving changes.
If you run several platforms, give each one its own slots. The roaster kept Instagram in the evening and moved Facebook updates to weekday lunchtime, where its older, local audience was reading. For more ways to present these findings to a client or manager, the business guides hub collects the reporting and scheduling guides in one place.
Step-by-step
Common mistakes to avoid
Pro tips
Frequently asked questions
Is there a single best time to post on social media?
No. Published charts average many unrelated accounts. Your best time depends on your followers' routines, time zones and the platform, so measure it from your own post history.
How many posts do I need before the heatmap is useful?
Aim for at least 30 to 40 posts spread across different days and times. Cells backed by one or two posts are too noisy to act on, which is why the dashboard shows the count.
Why does my YouTube export not appear in the hour grid?
YouTube Studio and X content exports include publish dates but not times. They still count toward totals and trends, but the heatmap needs per-post times from TikTok, Meta or LinkedIn exports.
Are my analytics files uploaded anywhere?
No. The files are read in your browser and kept in this browser's storage until you click Clear data. There is no login, API connection or scraping.
Should I post at the same time on every platform?
Usually not. Audiences and feeds differ, so find the best slots per platform and schedule each network separately.
The best time to post is a measurement, not a rumor. Export your own post history, read the weekday and 3-hour heatmap with the post counts in mind, move your posting slots to the strongest hours, and test for a month before you trust the result. Repeat each quarter, and let your audience, not an industry chart, set the schedule.
Related guides
Browse more: all business guides · the Social Media Analytics Dashboard