Monthly Social Media Report Template (Free, No Login)
A monthly social media report answers three questions for whoever pays for the work: what happened, why, and what changes next month. Most reports fail by answering none of them, pasting forty screenshots of native dashboards instead. This template keeps the report to one page plus an appendix and builds it from the analytics exports each platform already gives you. The worked example is a fictional gym, Harbor Street Fitness, reporting September across Instagram, Facebook and YouTube, with GrabCast's free Social Media Analytics Dashboard doing the merging and the month-over-month comparison in the browser. You will leave with a section list you can reuse, a routine that takes about thirty minutes a month, and wording that keeps the numbers honest.
📊 Try the Social Media Analytics Dashboard now — freeOpen →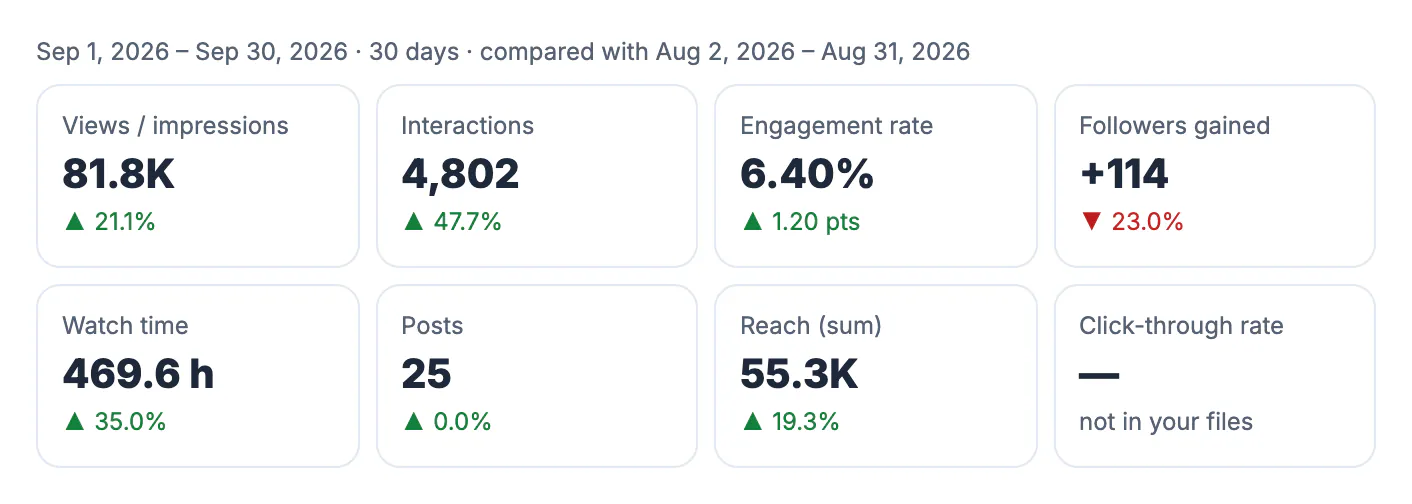
Clients and managers skim. A report that opens with the same six blocks every month trains the reader to find the answer in seconds, and makes changes stand out. Consistency also protects you: when the definitions and the period are fixed, a bad month is visible early and can be explained, instead of hidden among screenshots. Building from exports rather than screenshots matters too. Exports can be merged, filtered to the exact month and compared with the previous month, and the numbers are the platforms' own. Screenshots cannot be re-cut, and different native dashboards define views and engagement differently, which invites arguments about whose number is right. A one-page summary with an appendix gives the skimmer the story and the analyst the detail.
The six sections of a monthly social media report template
Keep the order fixed so the reader always knows where to look.
- Headline: one sentence on the month, such as September views up 21 percent and engagement rate up 1.2 points, while new followers slowed.
- Summary numbers: views or impressions, interactions, engagement rate, followers gained and posts, each with the change against the previous month.
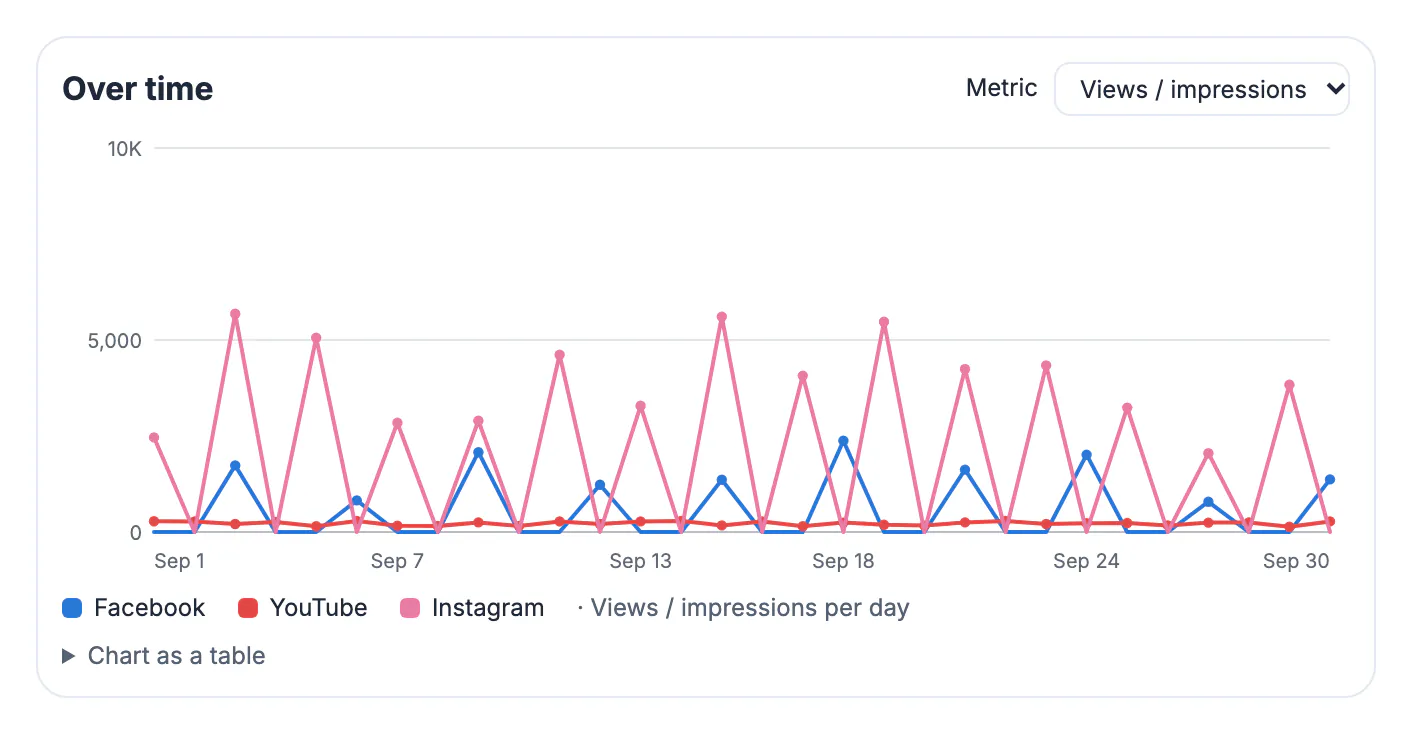
- Trend: one chart of the main metric per day or week, by platform.
- Platforms compared: a small table so the reader sees where the audience and the reaction came from.
- Top posts: the five best by engagement rate or by views, with one line on why they worked.
- Next month: three concrete actions, each tied to a number above.
Everything else, including per-post tables, goes in an appendix or a CSV attachment.
Build the report from platform exports in about thirty minutes
Download the exports on the first working day of the month, covering at least the last two months so you can compare.
- Instagram and Facebook: Meta Business Suite, Insights, Content, Export data.
- TikTok: TikTok Studio, Analytics, Download data.
- YouTube: YouTube Studio, Analytics, Advanced mode, then export the chart data or table data.
- LinkedIn and X: their analytics pages each have an Export button.
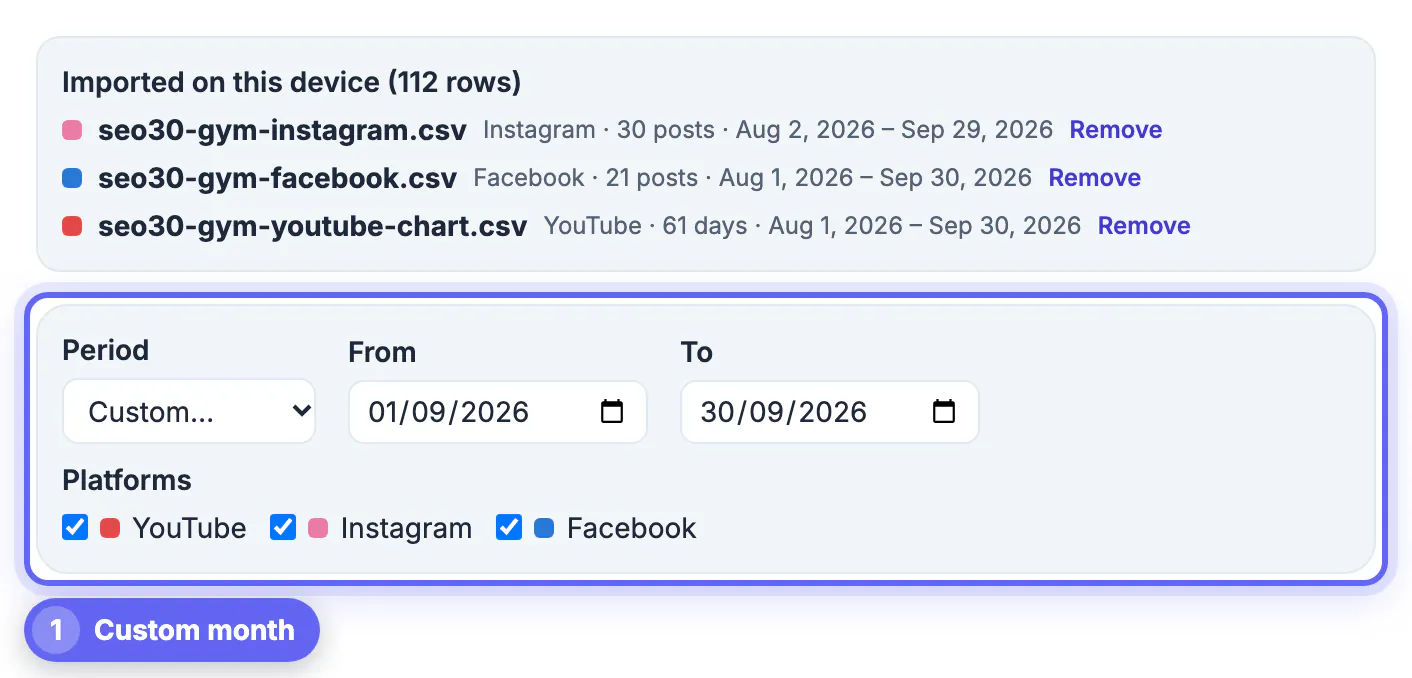
Drop the files on the Social Media Analytics Dashboard. Choose Custom in the Period menu and set the first and last day of the month; the summary cards then show the change against the same number of days right before, which for a full month is the previous month. For Harbor Street Fitness that meant September 1 to 30 compared with August 2 to 31, close enough to month over month for a client report, and stated in the period line so nobody is surprised.
Write the numbers so they cannot be misread
Most report disputes are about definitions, not performance. A few habits prevent them.
- Say whether a total is views or impressions. LinkedIn and X report impressions; video platforms report views.
- State the engagement formula once, for example interactions divided by views, and never switch mid-year.
- Give changes in percentage points for rates, such as 6.2 to 6.6 percent is plus 0.4 points, not plus 6 percent.
- Note when a platform's export lacks a metric, for example watch time appears only for YouTube.
- Round sensibly: 58.9K reads better than 58,912 in a summary.
If you track website visits from social posts, tag the links with the UTM Builder so the report can add a line on clicks and sign-ups from Google Analytics.
Share the report without sharing logins
The dashboard runs in your browser and keeps the merged data on your device, so there are no client logins to manage. When the page looks right, export it.
- Dashboard PNG: a single image of the summary for an email or chat message.
- Print or save as PDF: a clean page for the appendix or a client folder, with the filters and buttons hidden.
- Merged data CSV: every row in the current filter, for anyone who wants to check the math.
- Clear data when you finish if you work on a shared computer.
Then write the headline and the three next-month actions yourself. Those two parts are the reason a client reads the report, and no tool should write them for you. For planning those actions, the business guides hub covers scheduling, best posting times and engagement.
Step-by-step

Common mistakes to avoid
Pro tips
Frequently asked questions
What should a monthly social media report include?
A one-line headline, summary numbers with month-over-month change, a trend chart, a platform comparison, the top posts and three actions for next month. Detail goes in an appendix.
How do I compare this month with last month?
Set a custom period for the month. The summary cards compare it with the same number of days immediately before, which covers the previous month.
Do I need my clients' passwords?
No. Ask for the analytics exports, or have the client add you in Meta Business Suite or TikTok Studio with a role that can export. The dashboard needs only the files.
Can I send the report as a PDF?
Yes. Use Print or save as PDF in your browser, or download a PNG of the dashboard, and attach the merged CSV for the full data.
Why do my totals differ slightly from the native apps?
Platforms define metrics differently and post exports are lifetime totals when exported. The dashboard also avoids double counting by using daily totals when a file has them.
A good monthly social media report is short, consistent and honest about definitions. Build it from exports rather than screenshots, compare the exact month with the one before, show one trend, one comparison and the top posts, and finish with three actions. The dashboard handles the merging and arithmetic in your browser; the headline and the plan are yours to write.
Related guides
Browse more: all business guides · the Social Media Analytics Dashboard