Social Media Report for Clients: Write the Summary Page
A social media report for clients should answer three questions on its first page: how did we do compared with last period, why, and what happens next. Most reports bury those answers under pages of charts, and the client reads only the cover. This guide shows how to write the summary page that clients actually read, with every number traceable to its source, and how to build the full report with a share link. The example is a fictional café's September in the Reports and Analytics views of GrabCast's free Scheduler, where a standard summary is written from your own numbers without AI.
📅 Try the Social Media Scheduler now — freeOpen →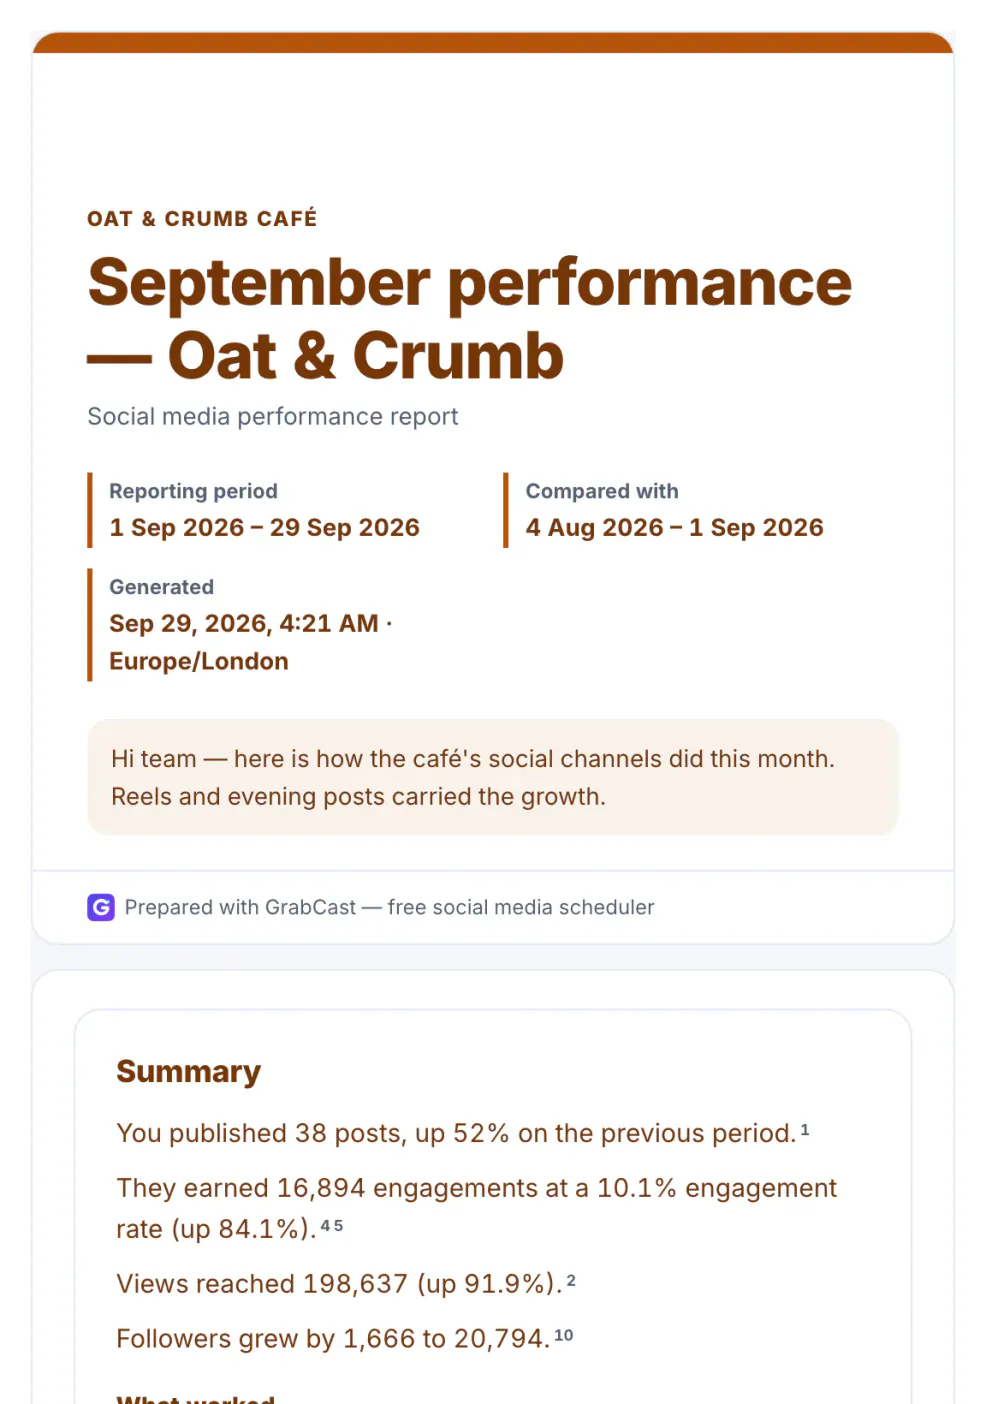
Clients are busy, and many are not marketers. A page of engagement-rate charts invites the question so, is that good? A summary answers it in sentences: posts published, the change on last period, the best-performing format, the thing that went wrong and what you will try next month. Done well, it also protects you. Every number should come from the data and every claim should stay within what the data can show, because a client will remember a promise such as reels caused the growth long after the chart is forgotten. Patterns in one account's data show correlation, not cause, and the summary should say so.
What a client report summary should say
Four short blocks cover almost every client:
- Results: posts published, reach or views, engagements and the engagement rate, each against the previous period.
- What worked: the best post and why it may have worked, the strongest format and network, a standout day.
- Keep an eye on: the weakest post, failed or missed posts, a drop in frequency.
- Next three actions: specific, testable, tied to a number above.
Write numbers exactly as they appear in your data, round consistently, and avoid words like proves or caused. Use may point to and worth testing instead.
Get the summary written from your own numbers
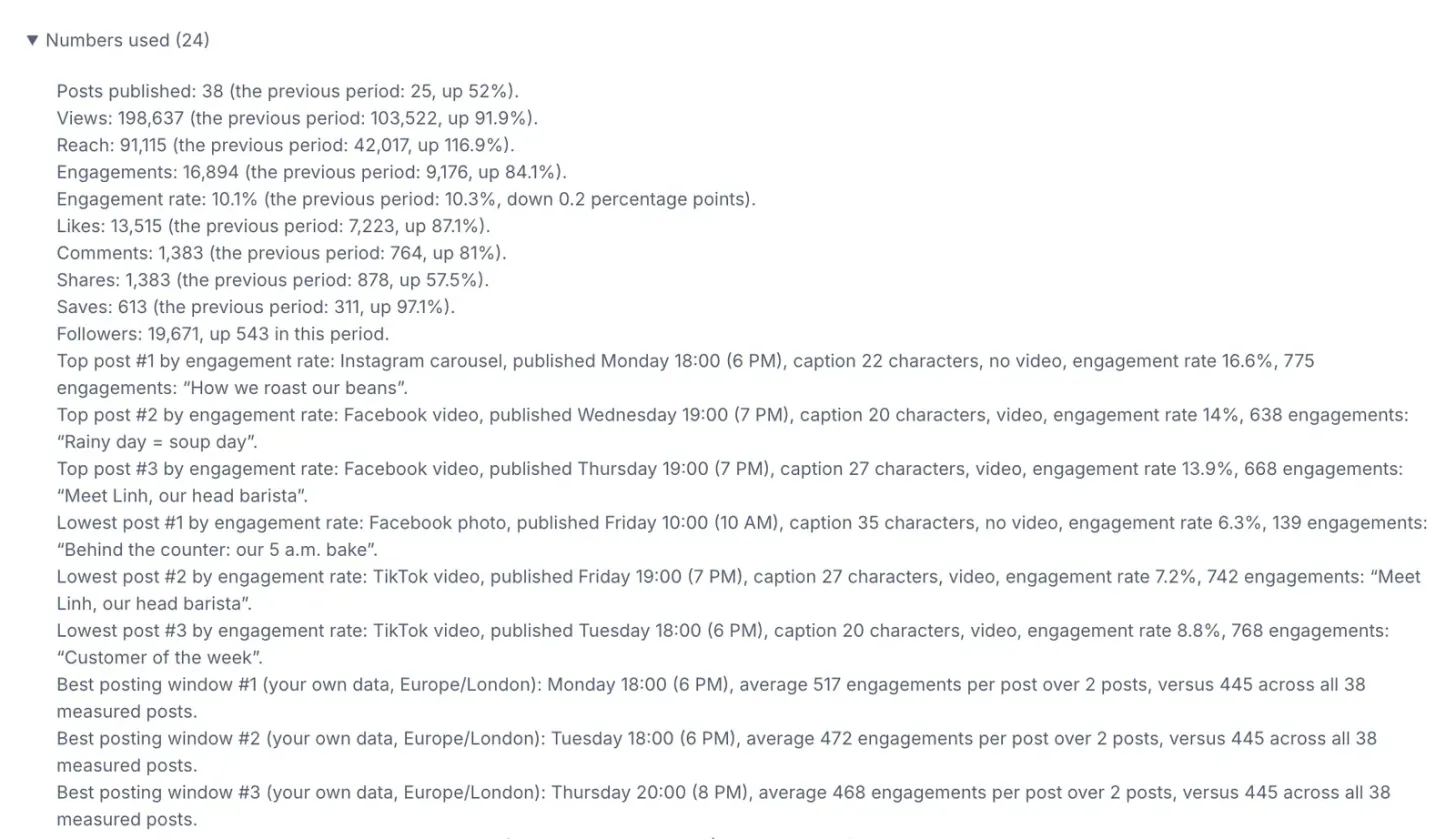
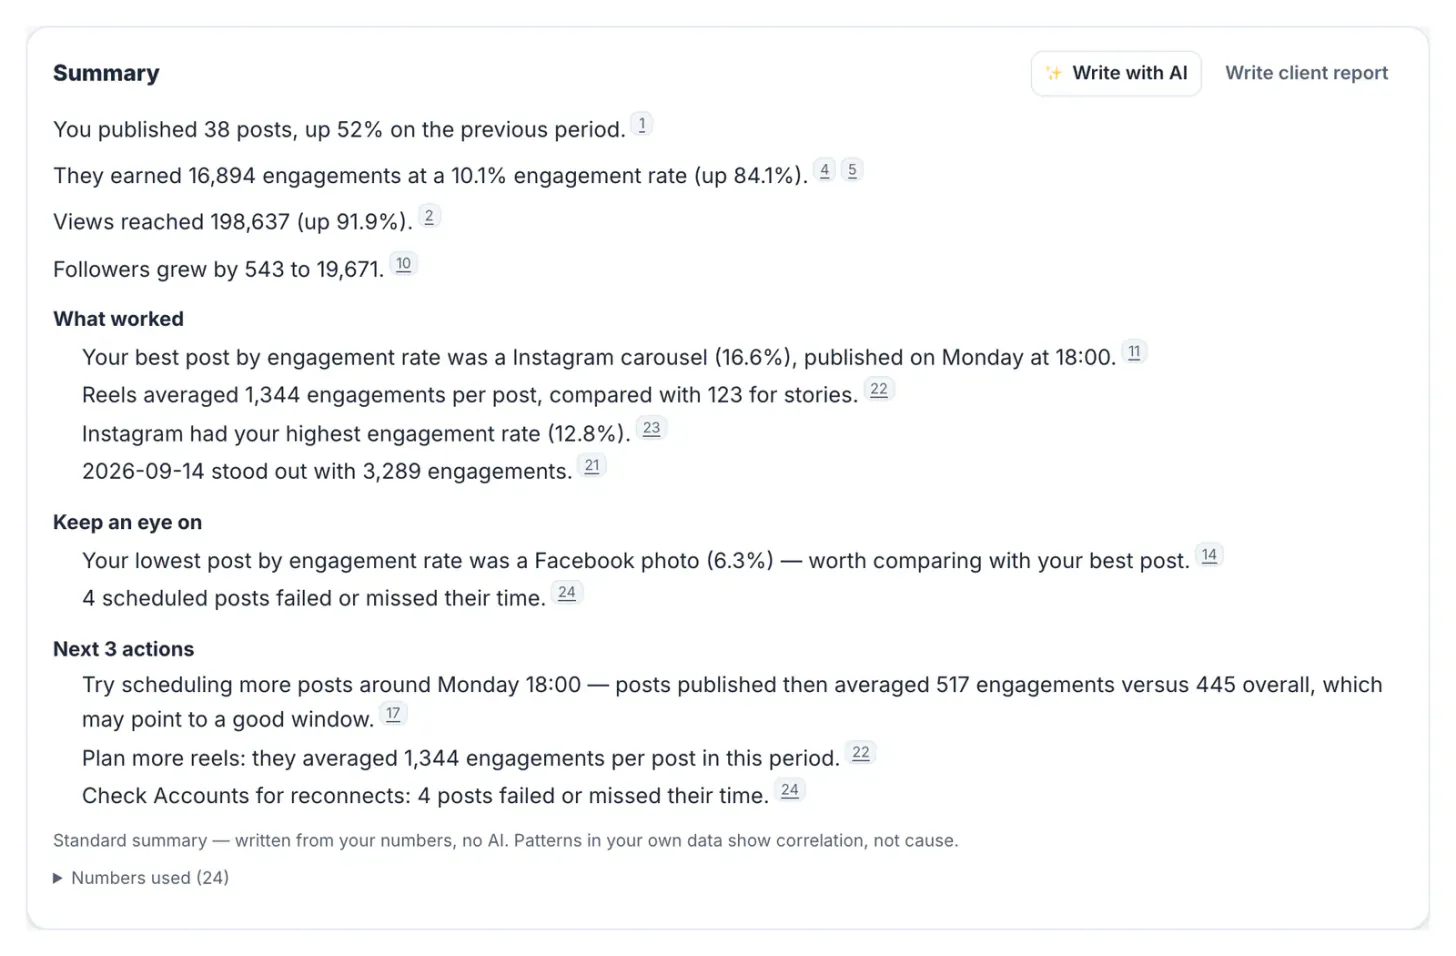
In the Scheduler's Analytics view, with your client's accounts connected, the Summary card writes these blocks for the selected period. The standard summary uses no AI: it is built from the numbers, and every sentence carries small numbered references. For the café's September it read: You published 38 posts, up 52% on the previous period. They earned 16,894 engagements at a 10.1% engagement rate (up 84.1%). It then listed what worked (an Instagram carousel at 16.6%, reels averaging 1,344 engagements per post), what to watch (4 scheduled posts that failed or missed their time) and three next actions.
- Open Numbers used to see every fact a sentence cites, with the previous period next to it.
- Best posting windows appear only when there are at least 20 measured posts, and they come from your own data.
- With fewer than 5 posts in the period there is no summary, because there is nothing reliable to say.
- Write with AI is optional. It rephrases the same facts on your device or with your own key first; any sentence with a number that isn't in the facts, or a claim of cause, is removed and replaced with the standard text.
The analytics come from what each network reports through its API; metrics a network doesn't provide show as missing, never as zero.
Build the full report around the summary
Press Write client report on the Summary card. The report builder opens with the same period and the Summary page right after the cover. The café's report opened with September performance, Oat & Crumb, the reporting period, the comparison period and a short note to the client, then the summary.
- Start from a built-in template: Monthly client report, Weekly performance or Campaign report, or save your own.
- Turn sections on or off, pick A4 or Letter and English or Vietnamese.
- White label per workspace: your client's or your agency's name, colour and logo, and hide Prepared with GrabCast.
- Refreshing the numbers drops any saved summary text, so an old narrative never sits next to new data.
If your client's accounts aren't connected, the Social Media Analytics dashboard works from the networks' own export files instead.
Share, schedule and explain the report
Save the report, then share it the way the client prefers:
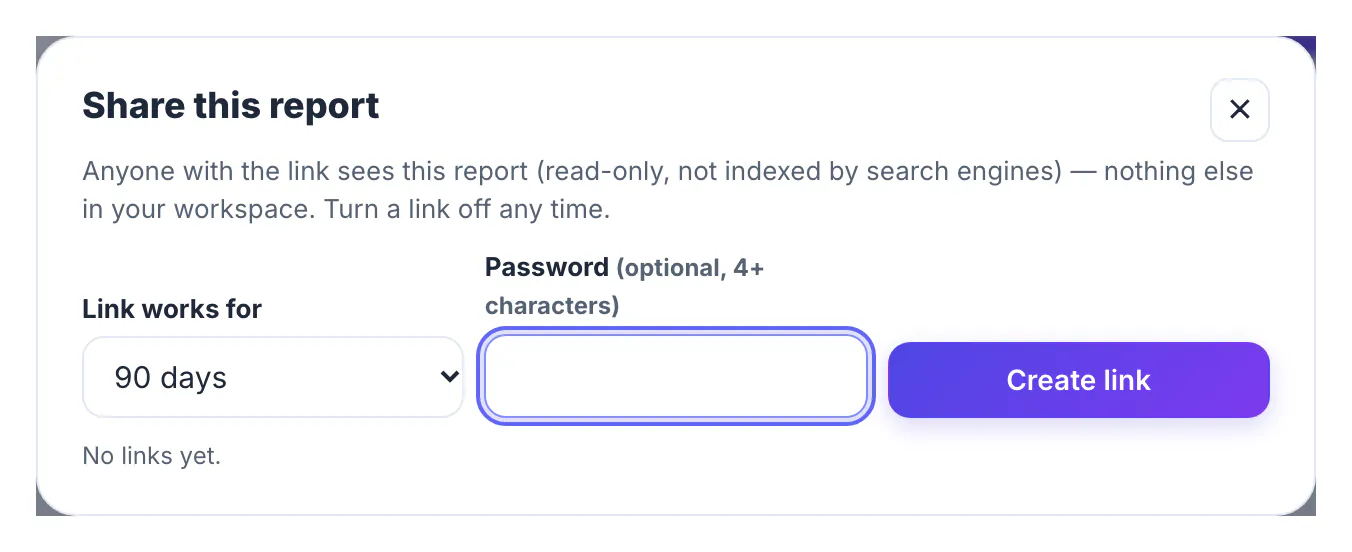
- Share link: read-only, not indexed by search engines, valid for 1 to 365 days, with an optional password. You can turn a link off at any time.
- PDF, CSV or Excel download; the summary is the first page of the PDF and the first sheet of the spreadsheets.
- Scheduled e-mails: weekly or monthly, to up to five recipients, with a summary and a fresh link.
In shared workspaces, a Client role can open and download reports without seeing or changing anything else. In the review call, read the summary aloud, agree on the three actions and put them in next month's content plan. The UTM Builder helps when one of those actions is to measure clicks to the client's website.
Step-by-step
Common mistakes to avoid
Pro tips
Frequently asked questions
What should a social media report for clients include?
A summary page with results against the previous period, what worked, what to watch and three next actions, followed by the detail: charts, top posts, audience and publishing.
Is the summary written by AI?
The standard summary is not; it is built from your numbers with a reference for each figure. Write with AI is optional, and sentences with numbers not in your data are removed.
Can I white-label the client report?
Yes. Each workspace can set a name, colour and logo for reports and hide the Prepared with GrabCast line.
How do clients see the report?
Through a read-only share link that expires after 1 to 365 days and can have a password, a PDF or spreadsheet download, or scheduled weekly or monthly e-mails.
What if a network doesn't report a metric?
It is shown as missing rather than zero, and the summary only uses facts that were reported.
A social media report for clients works when its first page speaks plainly: results against last period, what worked, what to watch and three next actions, with every number traceable. Let the standard summary do the first draft, check the numbers it cites, and spend your time on the actions.
Related guides
Browse more: all business guides · the Social Media Scheduler